

During the summer of 2002, I took to the road, driving across the United States in order to find out if all those maps we buy are really representative of the world that is out there. As I drove, I would occasionally mark locations in my GPS unit to remember places that I'd been.
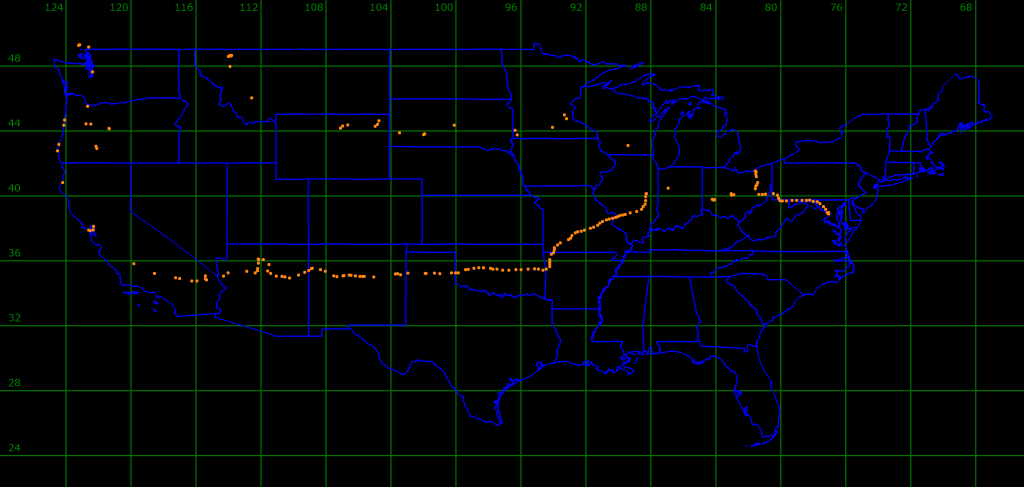
As part of an initiative to plot other geographical data, I developed a command line PHP tool that could handle ArcView ASCII-exported shape files. Primed with the GPS data I'd captured during my drive and tweaked slightly to produce ideal output, the images below represent three stages in the PHP / GIS tool development: the completed composite, the completed path example without state outlines, and the simple datapoint plot with state outlines.
<?php
    /*  CreateGraphic Version 1.1 (07/12/2003 - 23:28:16)
                      -- added progress bar and automatic image flipping
                      -- tweaked database data to CONUS and fixed San Luis Obispo
                      Version 1.2 (07/13/2003 - 01:50:55)
                      -- eliminated imagesetpixel() call. why mark a spot twice?
                      -- imagefilledellipse() call now, coverage areas more apparent.
                      -- added lat/long lines and markers
                      Version 1.2rs (07/14/2003 - 14:35:32)
                      -- working with pubacc_rs "Receive Sites" database, there are approx 6.5:1 receivers to transmitters
                      Version 2.0 (07/14/2003 - 15:23:15) (07/15/2003 - 09:40:52)
                      -- adding state-level outlines using U.S. Census Bureau TIGER Database
                      -- http://www.census.gov/geo/www/cob/bdy_files.html
                      Version 2.1 (07/15/2003 - 12:59:26)
                      -- switched to imagepolygon() function to draw state-level outlines.
                      Version 2.1mv (07/16/2003 - 00:19:16)
                      -- special fork to plot Way Out West GPS data.

                      (c)2003 Max Vilimpoc, all rights reserved.

        Boundaries of image -- CONUS
        No ITFS stations below      24 deg. North latitude (Key West, FL @ 24o33')
                         above      49 deg. North latitude (Bowbells, ND @ 48o43')

                         east of    67 deg. West  longitude (East Machias, ME @  67o24')
                         west of   125 deg. West  longitude (Coos Bay, OR     @ 124o14')
    */

    function DMS($d_decimal, &$dd, &$dm, $o) {
        $dd =   (int) substr($d_decimal, 2, $o);
        $dm =   (int) floor(substr($d_decimal, 2+$o, 2) * 60 / 100);
    }

    function Rasterize() {
        global $long_d, $long_m, $lat_d, $lat_m, $pos_x, $pos_y, $im_width, $im_height;    // so many globals....

        $pos_x = (($long_d - 67 + 2) * 60 + $long_m) - 1;     // -67degree minima, +120minute border, -1pixel (0,0)
        $pos_y = (($lat_d  - 24 + 2) * 60 + $lat_m)  - 1;

        $pos_x = $im_width  - $pos_x;   // flip image horizontally
        $pos_y = $im_height - $pos_y;   // flip image vertically
    }

    $im_width   =   (125 - 67 + 1 + 4) * 60;            //  3,780 px wide        //  accuracy of one minute.
    $im_height  =    (49 - 24 + 1 + 4) * 60;            //  1,800 px tall        //  6,804,000 8b; 20,412,000 24b;

    print "creating chart----$im_width x $im_height\n";
    $map        =   @imagecreatetruecolor($im_width, $im_height) or die ("Cannot initialize new GD image stream!\n");

/*  screen colors
    $m_itfs     =   imagecolorallocate($map, 255, 135, 17);
    $m_grid     =   imagecolorallocate($map, 0, 96, 0);
    $m_states   =   imagecolorallocate($map, 64, 64, 255);
    $m_text     =   imagecolorallocate($map, 255, 255, 0);
    $m_path     =   imagecolorallocate($map, 0, 255, 0);
*/
//  print colors
    $m_bgcolor  =   imagecolorallocate($map, 255, 255, 255);
    imagefill($map, 0, 0, $m_bgcolor);

    $m_itfs     =   imagecolorallocate($map, 0, 0, 0);
    $m_grid     =   imagecolorallocate($map, 96, 96, 96);
    $m_states   =   imagecolorallocate($map, 32, 32, 32);
    $m_text     =   imagecolorallocate($map, 0, 0, 0);
    $m_path     =   imagecolorallocate($map, 0, 0, 0);

    $verdana    =   $_ENV["windir"] . "\\Fonts\\verdana.ttf";
    $fontsize   =   28;

    print "adding latitude and longitude lines\n";
//  $lat    =   array(24, 26, 28, 30, 32, 34, 36, 38, 40, 42, 44, 46, 48, 50);
    $lat    =   array(24, 28, 32, 36, 40, 44, 48);
    foreach($lat as $v) {
        $text   =   $v;
        $v = ($im_height - (($v - 24 + 2) * 60) + 2); // print $v . "\n";
        imagefilledrectangle($map, 0, $v, $im_width, $v+3, $m_grid);
        imagettftext($map, $fontsize, 0, 30, $v - 14, $m_grid, $verdana, $text);
    }
    unset($lat);

//  $long   =   array(67, 70, 73, 76, 79, 82, 85, 88, 91, 94, 97, 100, 103, 106, 109, 112, 115, 118, 121, 124);
    $long   =   array(68, 72, 76, 80, 84, 88, 92, 96, 100, 104, 108, 112, 116, 120, 124);
    foreach($long as $v) {
        $text   =   $v;
        $v = ($im_width - (($v - 67 + 2) * 60) + 2); // print $v . "\n";
        imagefilledrectangle($map, $v, 0, $v+3, $im_height, $m_grid);
        $bbox   =   imagettfbbox($fontsize, 0, $verdana, $text);
        $text_width =   max($bbox[4] - $bbox[6], $bbox[2] - $bbox[0]);
        imagettftext($map, $fontsize, 0, $v - ($text_width + 15), 40, $m_grid, $verdana, $text);
    }
    unset($long);

    print "creating state-level outlines----\n";
    $filelist   =   fopen("census.gov.cartographics/filelist.txt", "r");
    while ($file = trim(fgets($filelist, 255))) {
        print "processing $file\n";
        $afp        =   fopen("census.gov.cartographics/$file", "r");

        while(!feof($afp)) {
            $line = fgets($afp, 255);           //  clear that first line of the record;
            if (stristr($line, "END")) break;   //  if we're at the end of file, break.
            $npoints    =   0;                  //  else, start a new shape.
            unset($shape);
            while ($line = fgets($afp, 255)) {
                if (stristr($line, "END")) break;
                $long   =   substr($line, 7, 7);
                $order  =   substr($line, 27, 1);
                DMS($long, $long_d, $long_m, $order);

                $lat    =   substr($line, 35, 6);
                DMS($lat, $lat_d, $lat_m, 2);

                Rasterize();
                if (($pos_x == $shape[($npoints*2)-2]) && ($pos_y == $shape[($npoints*2)-1])) {
    //              print "duplicate.\n";
                    continue;
                }

                $shape[] = $pos_x;
                $shape[] = $pos_y;
                $npoints++;
            }
            imagesetthickness($map, 4);
            if (count($shape) > 3) imagepolygon($map, $shape, $npoints, $m_states);
        }
        fclose($afp);
    }
    fclose($filelist);

    $afp    =   fopen("vilimpoc.trip.cartographics/Way-Out-West-Waypoints.txt", "r");   // format: -83.02842,40.10968,002,
    $num_rows   =   204; $percent_int   =   0; $target = 0;                             // load progress-bar triggers.
    $npoints    =   0;

    print "processing Way Out West GPS data----\n";
    print "0----1----2----3----4----5----6----7----8----9----| (x10%)\n";
    while($row = fgetcsv($afp, 255)) {
        $percent_int++;

        $long_d =   (int) floor($row[0]);
        $long_m =   (int) floor(($row[0] - floor($row[0])) * 60);

        $lat_d  =   (int) floor($row[1]);
        $lat_m  =   (int) floor(($row[1] - floor($row[1])) * 60);

        Rasterize();
        $path[] =   $pos_x;
        $path[] =   $pos_y;
        $npoints++;

        imagesetthickness($map, 1);
        imagefilledellipse($map, $pos_x, $pos_y, 13, 13, $m_itfs);

        if (stristr($row[3], "*")) {
            $bbox           =   imagettfbbox($fontsize, 0, $verdana, $row[2]);
            $text_width     =   max($bbox[4] - $bbox[6], $bbox[2] - $bbox[0]);
            $text_height    =   max($bbox[1] - $bbox[7], $bbox[3] - $bbox[5]);
            print "$row[2]: $text_width x $text_height\n";
            imagettftext($map, $fontsize, 0, $pos_x + 10, $pos_y + (int)($text_height / 2), $m_text, $verdana, $row[2]);
        }

        $percent_f = ((int)floor(($percent_int / $num_rows) * 100));                    // generate progress-bar trigger;
        if ($percent_f == $target) {
            print "*";
            $target += 2;                                                               // move target forward by 2%.
        }
    }
    print "\n";

    print "drawing trip path----\n";
    imagesetthickness($map, 3);
    for ($i = 0; $i < ($npoints-1); $i++) {
        imageline($map, $path[$i*2], $path[$i*2+1], $path[$i*2+2], $path[$i*2+3], $m_path);
    }
    print "saving chart.\n";
//  imagejpeg($map, "itfs-map.jpeg", 50);
    imagepng($map, "vilimpoc.trip.cartographics/wow-waypoints-map+path-print.png");
?>