
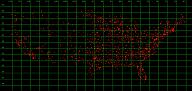
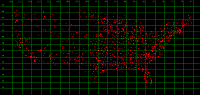
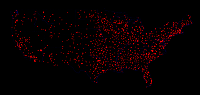
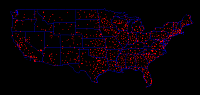
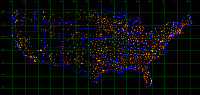
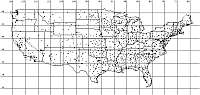
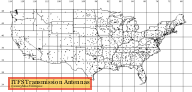
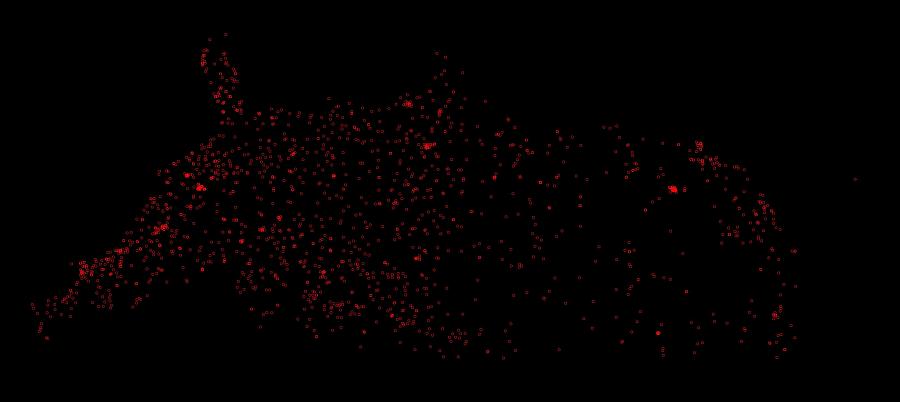
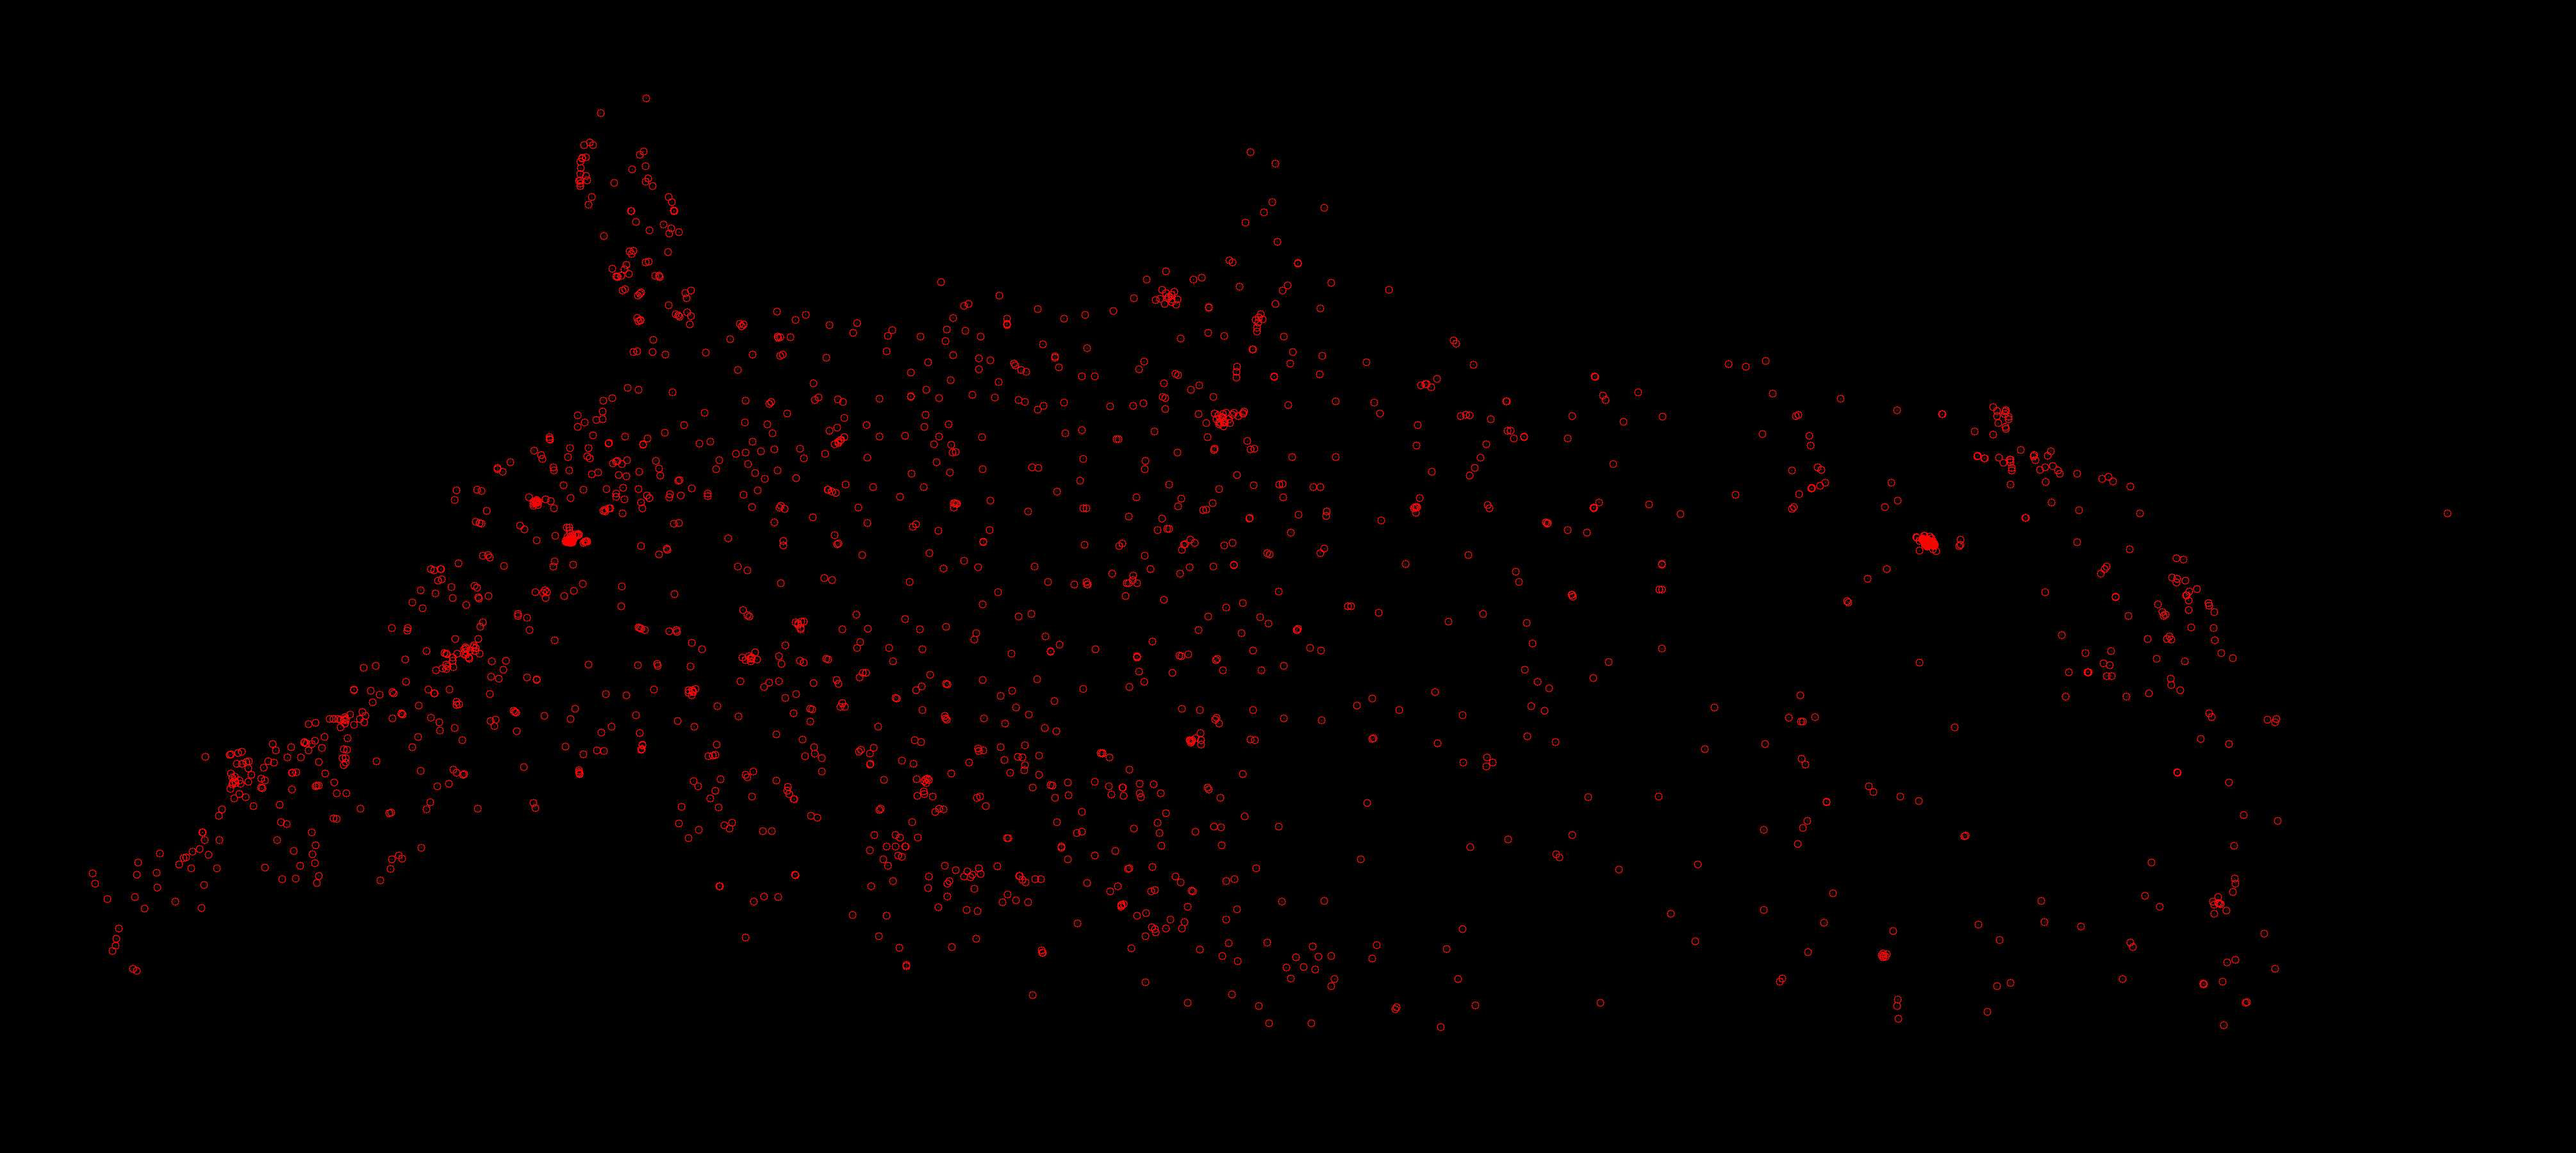
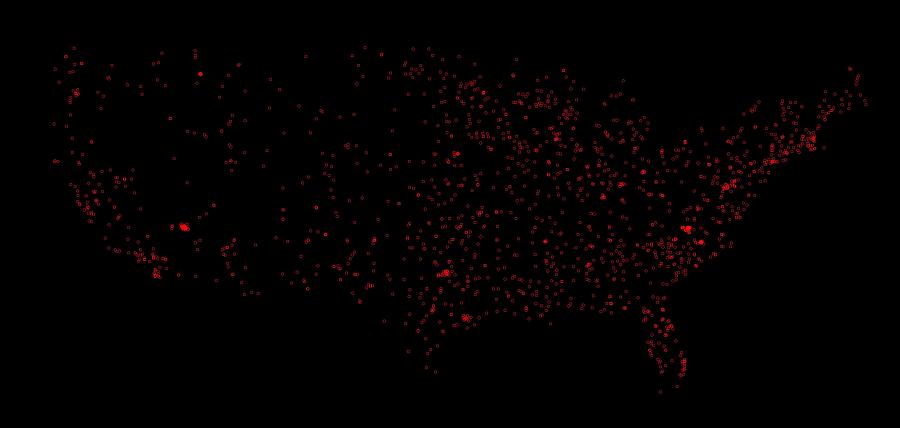
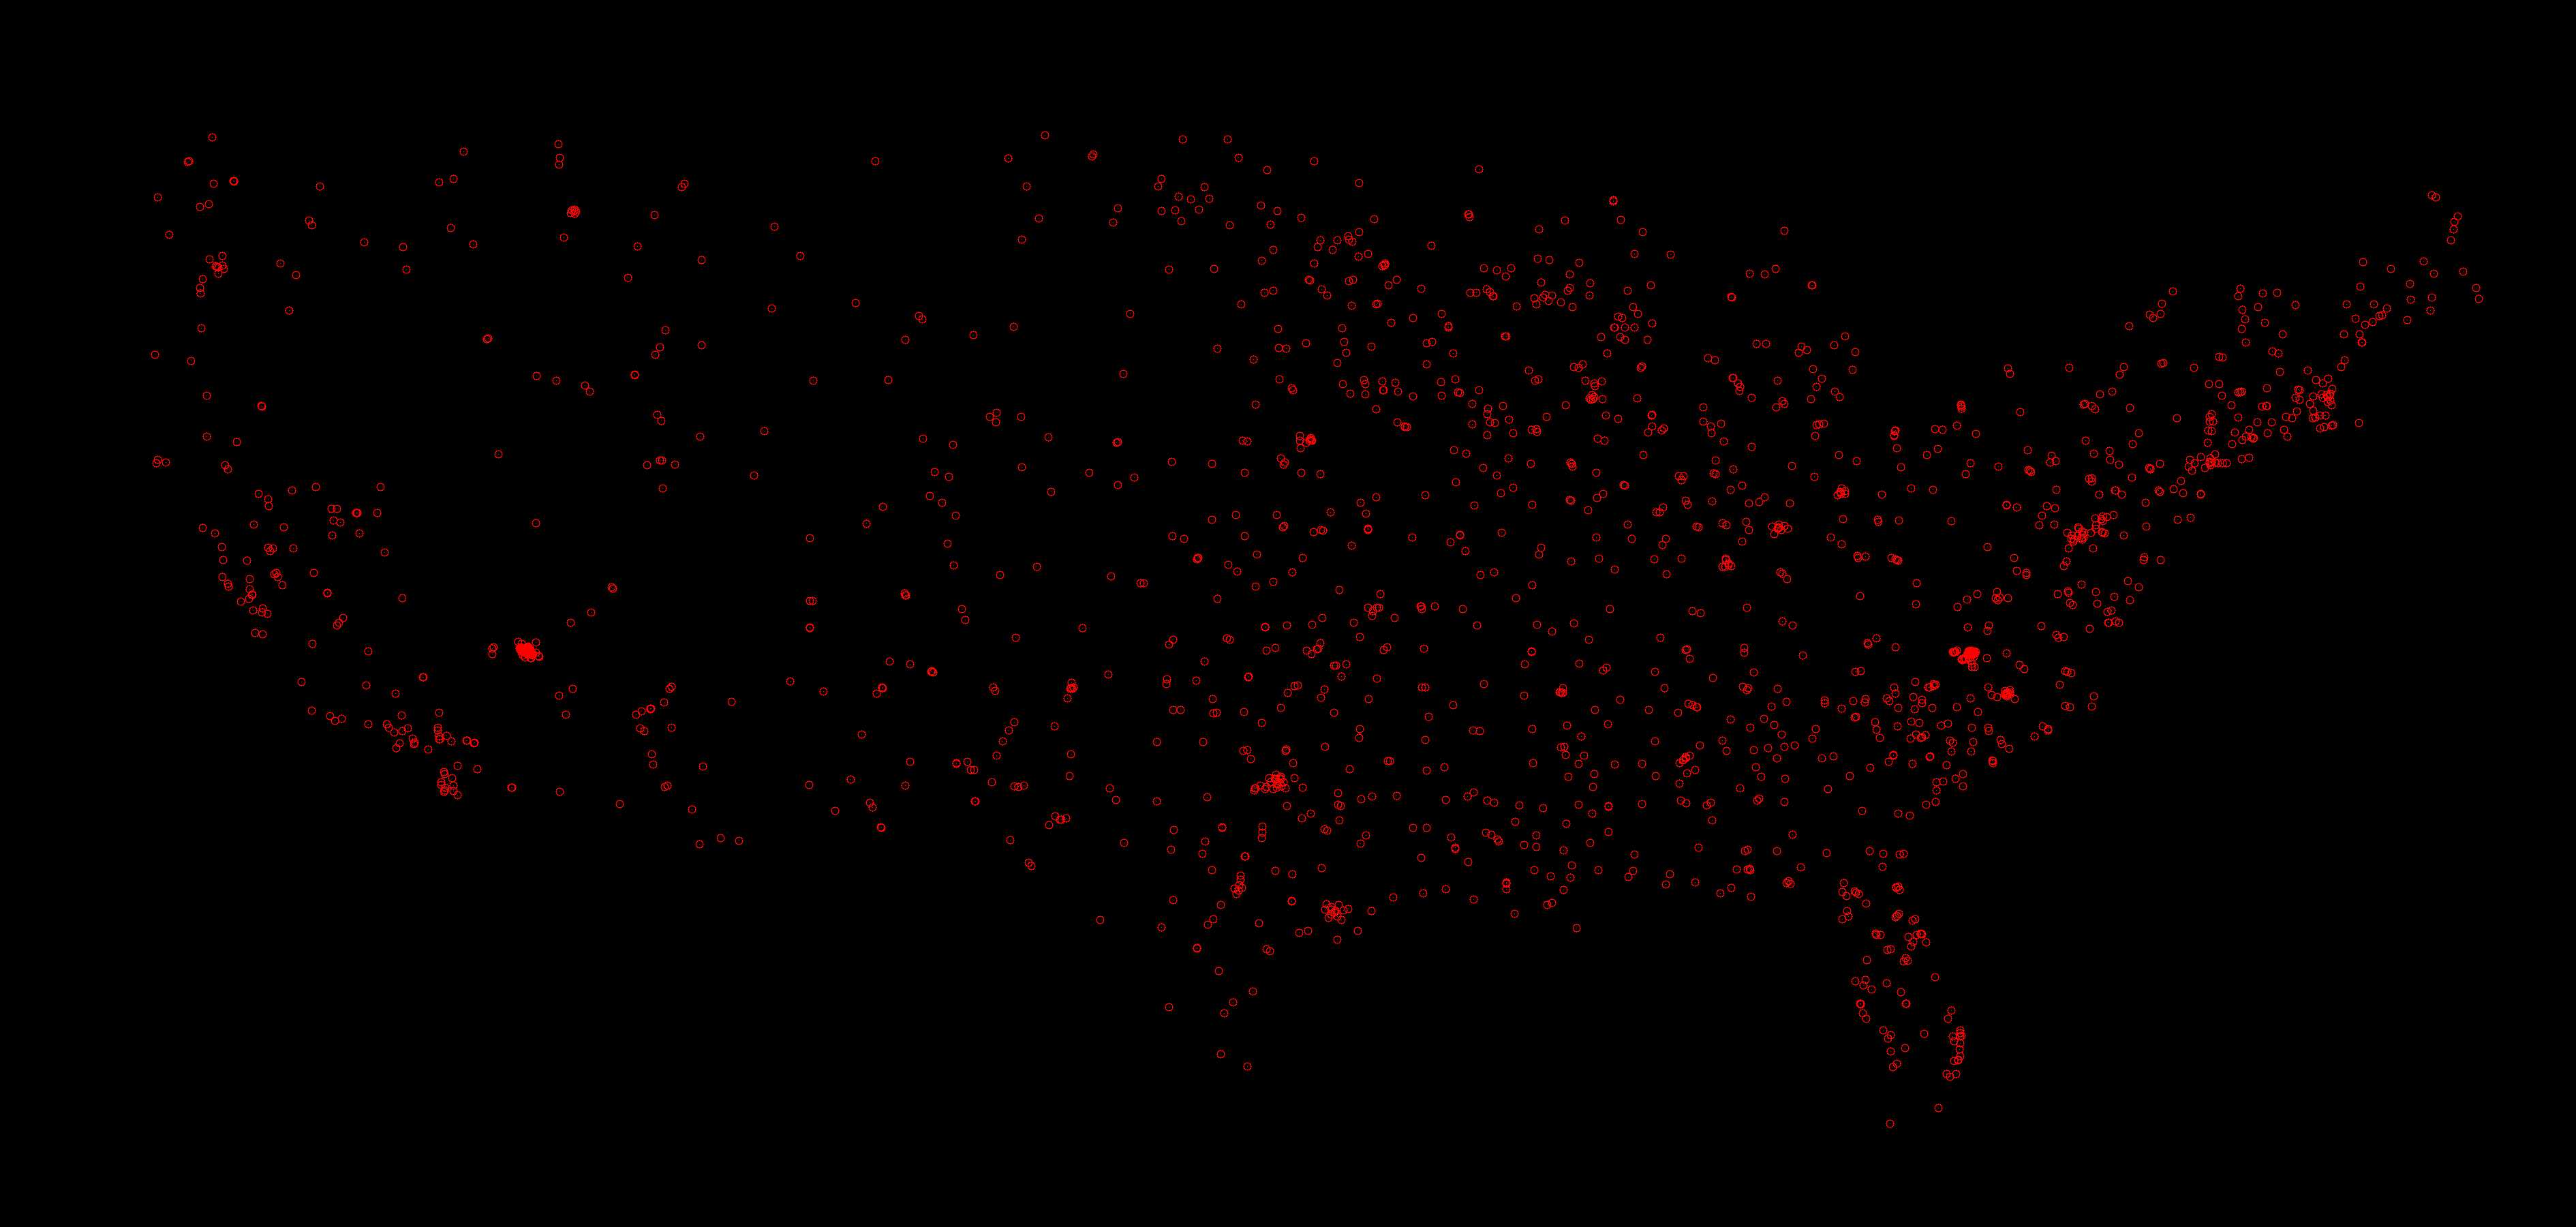
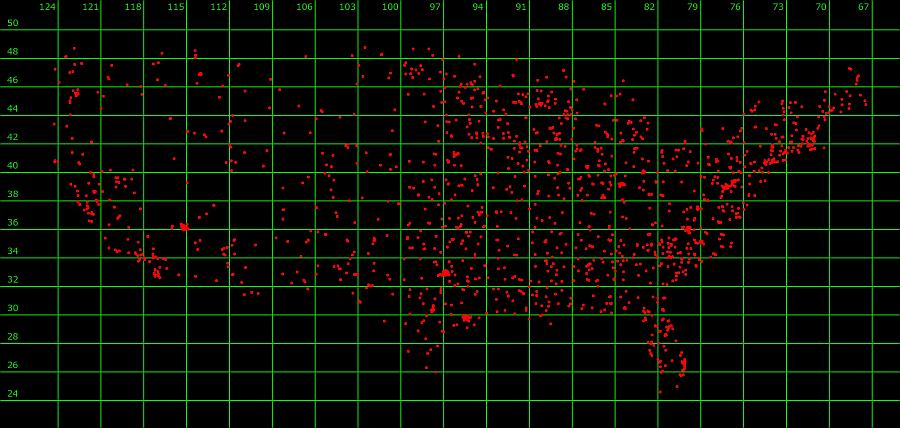
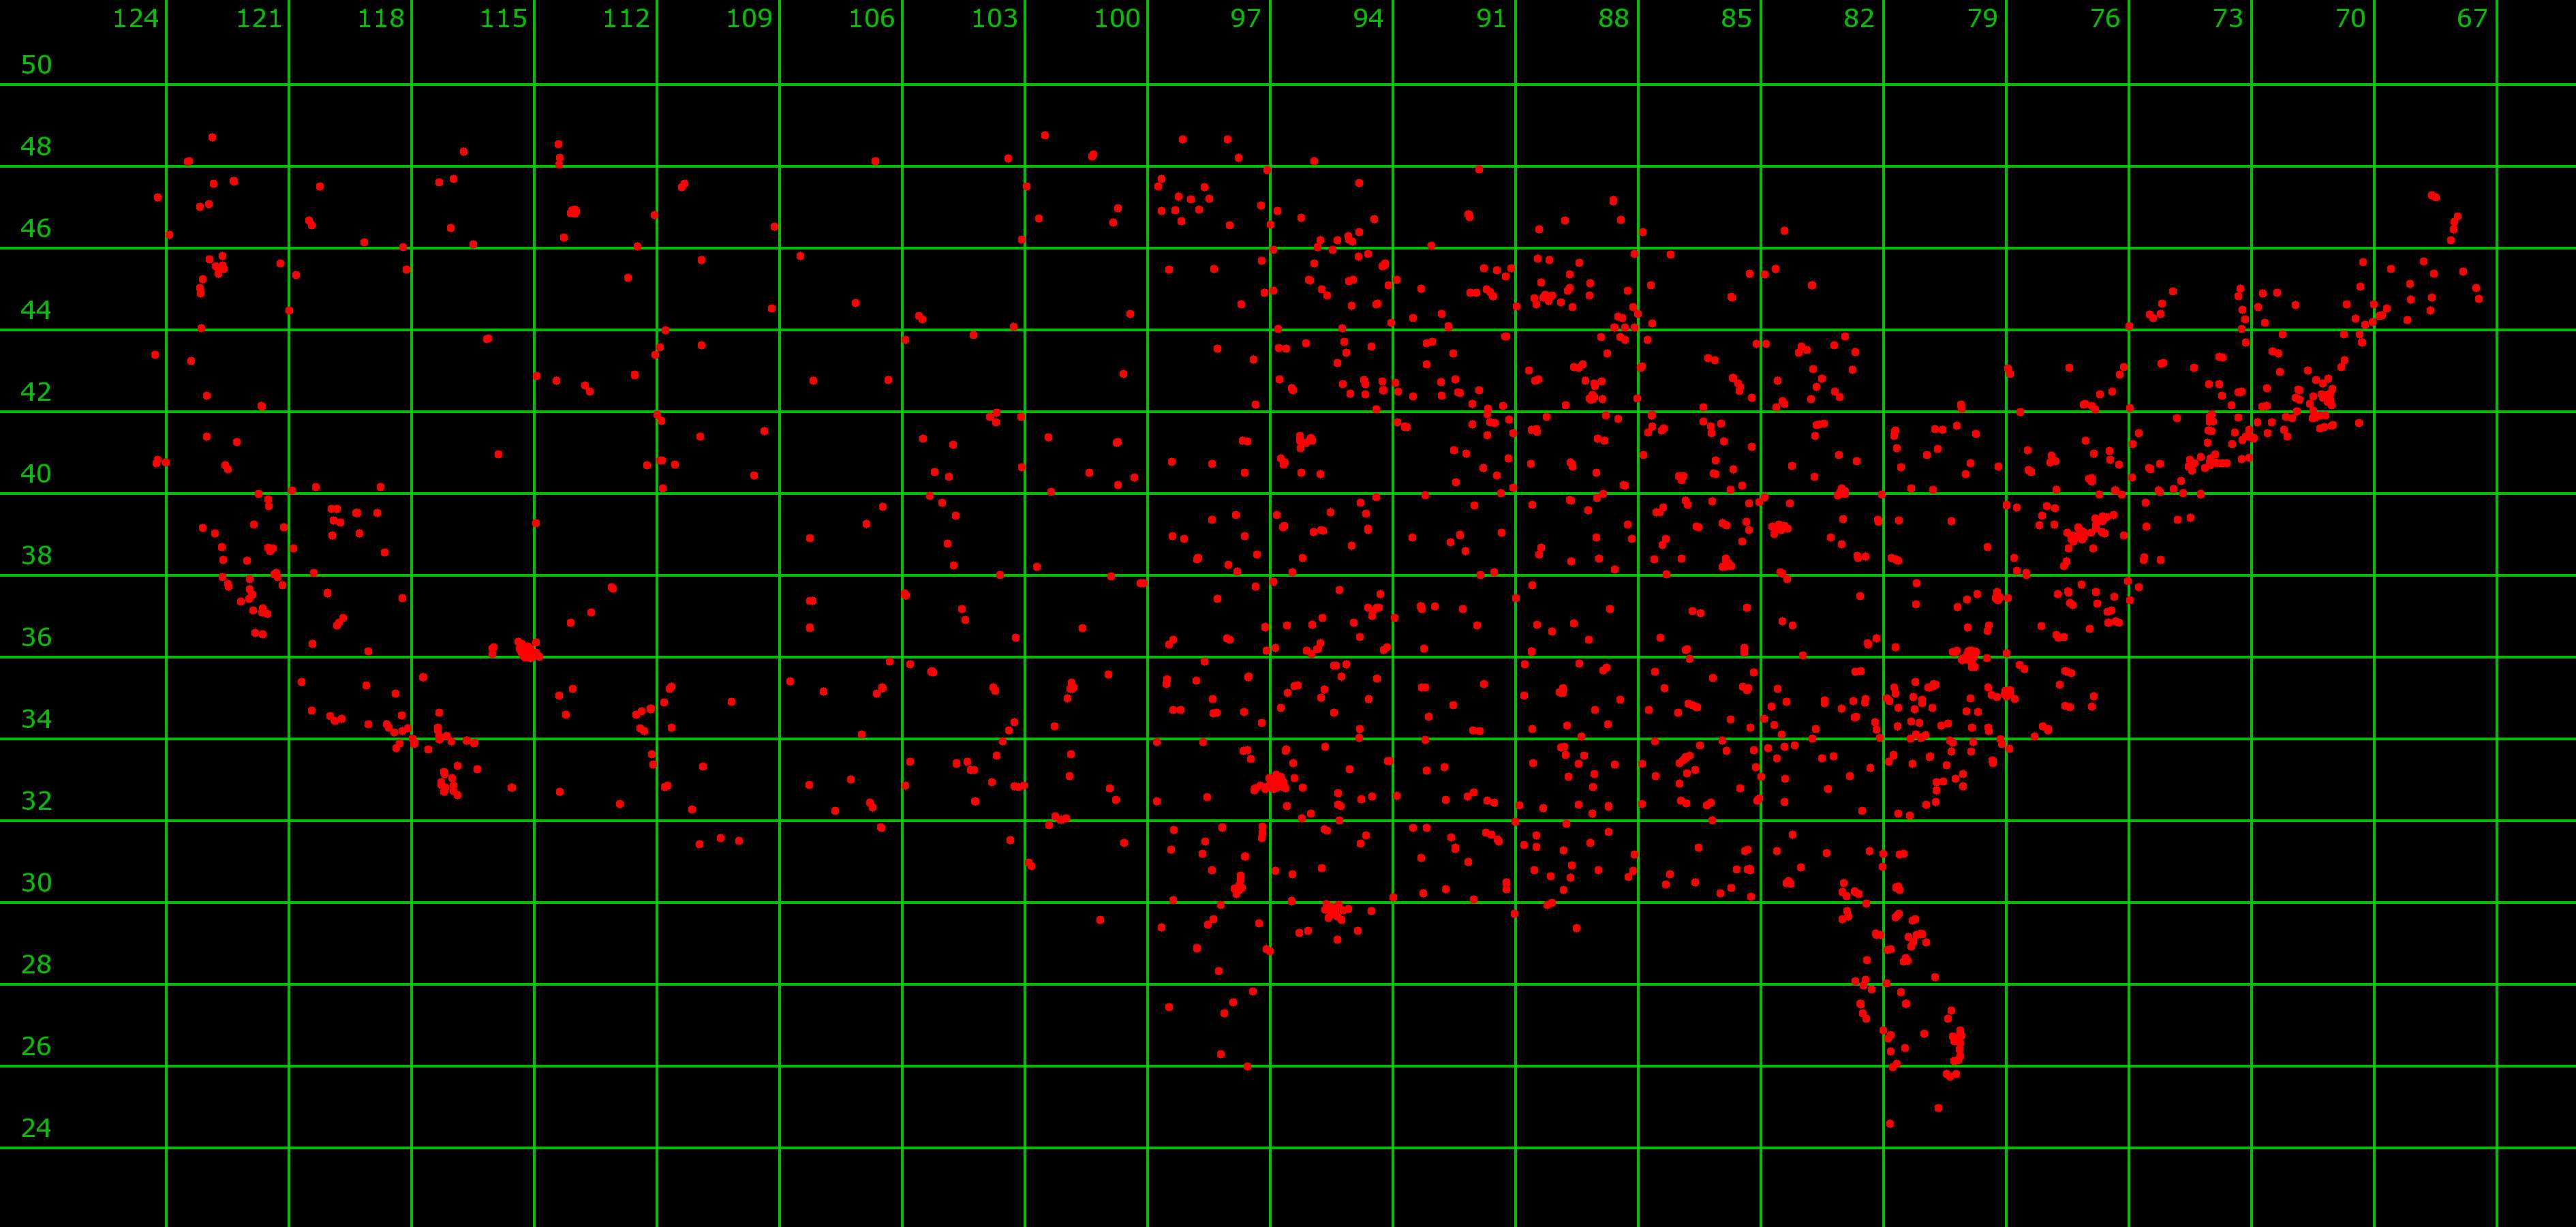
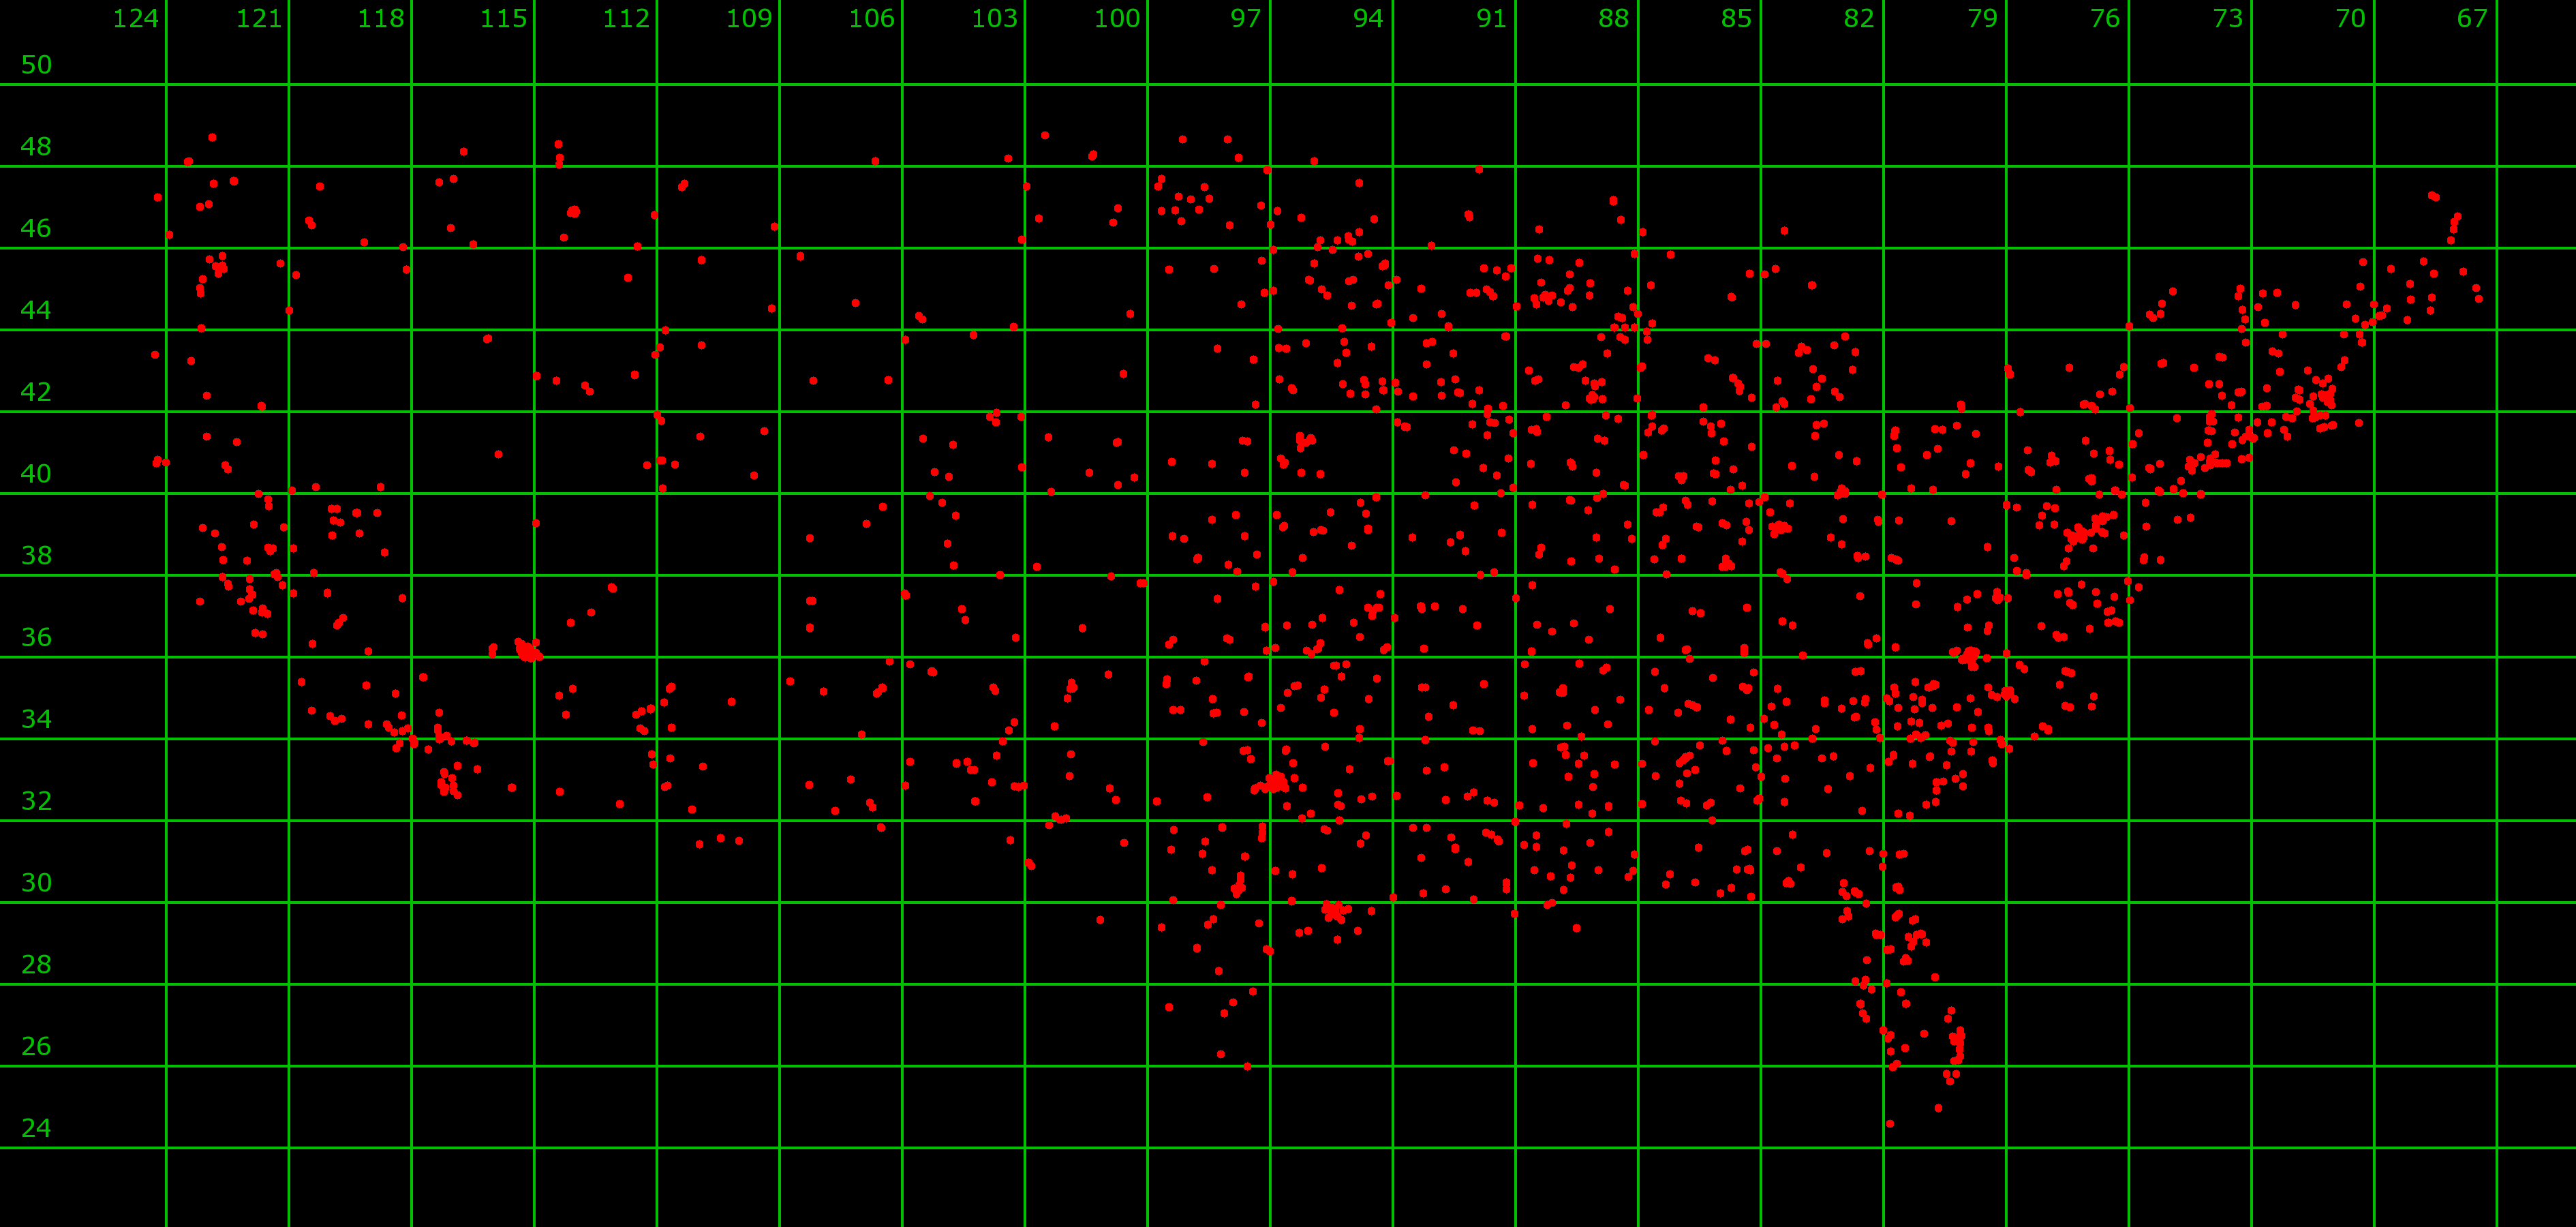
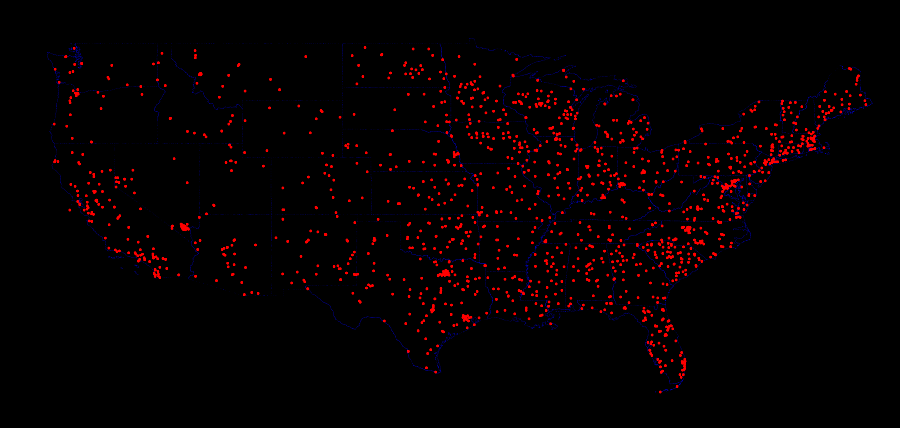
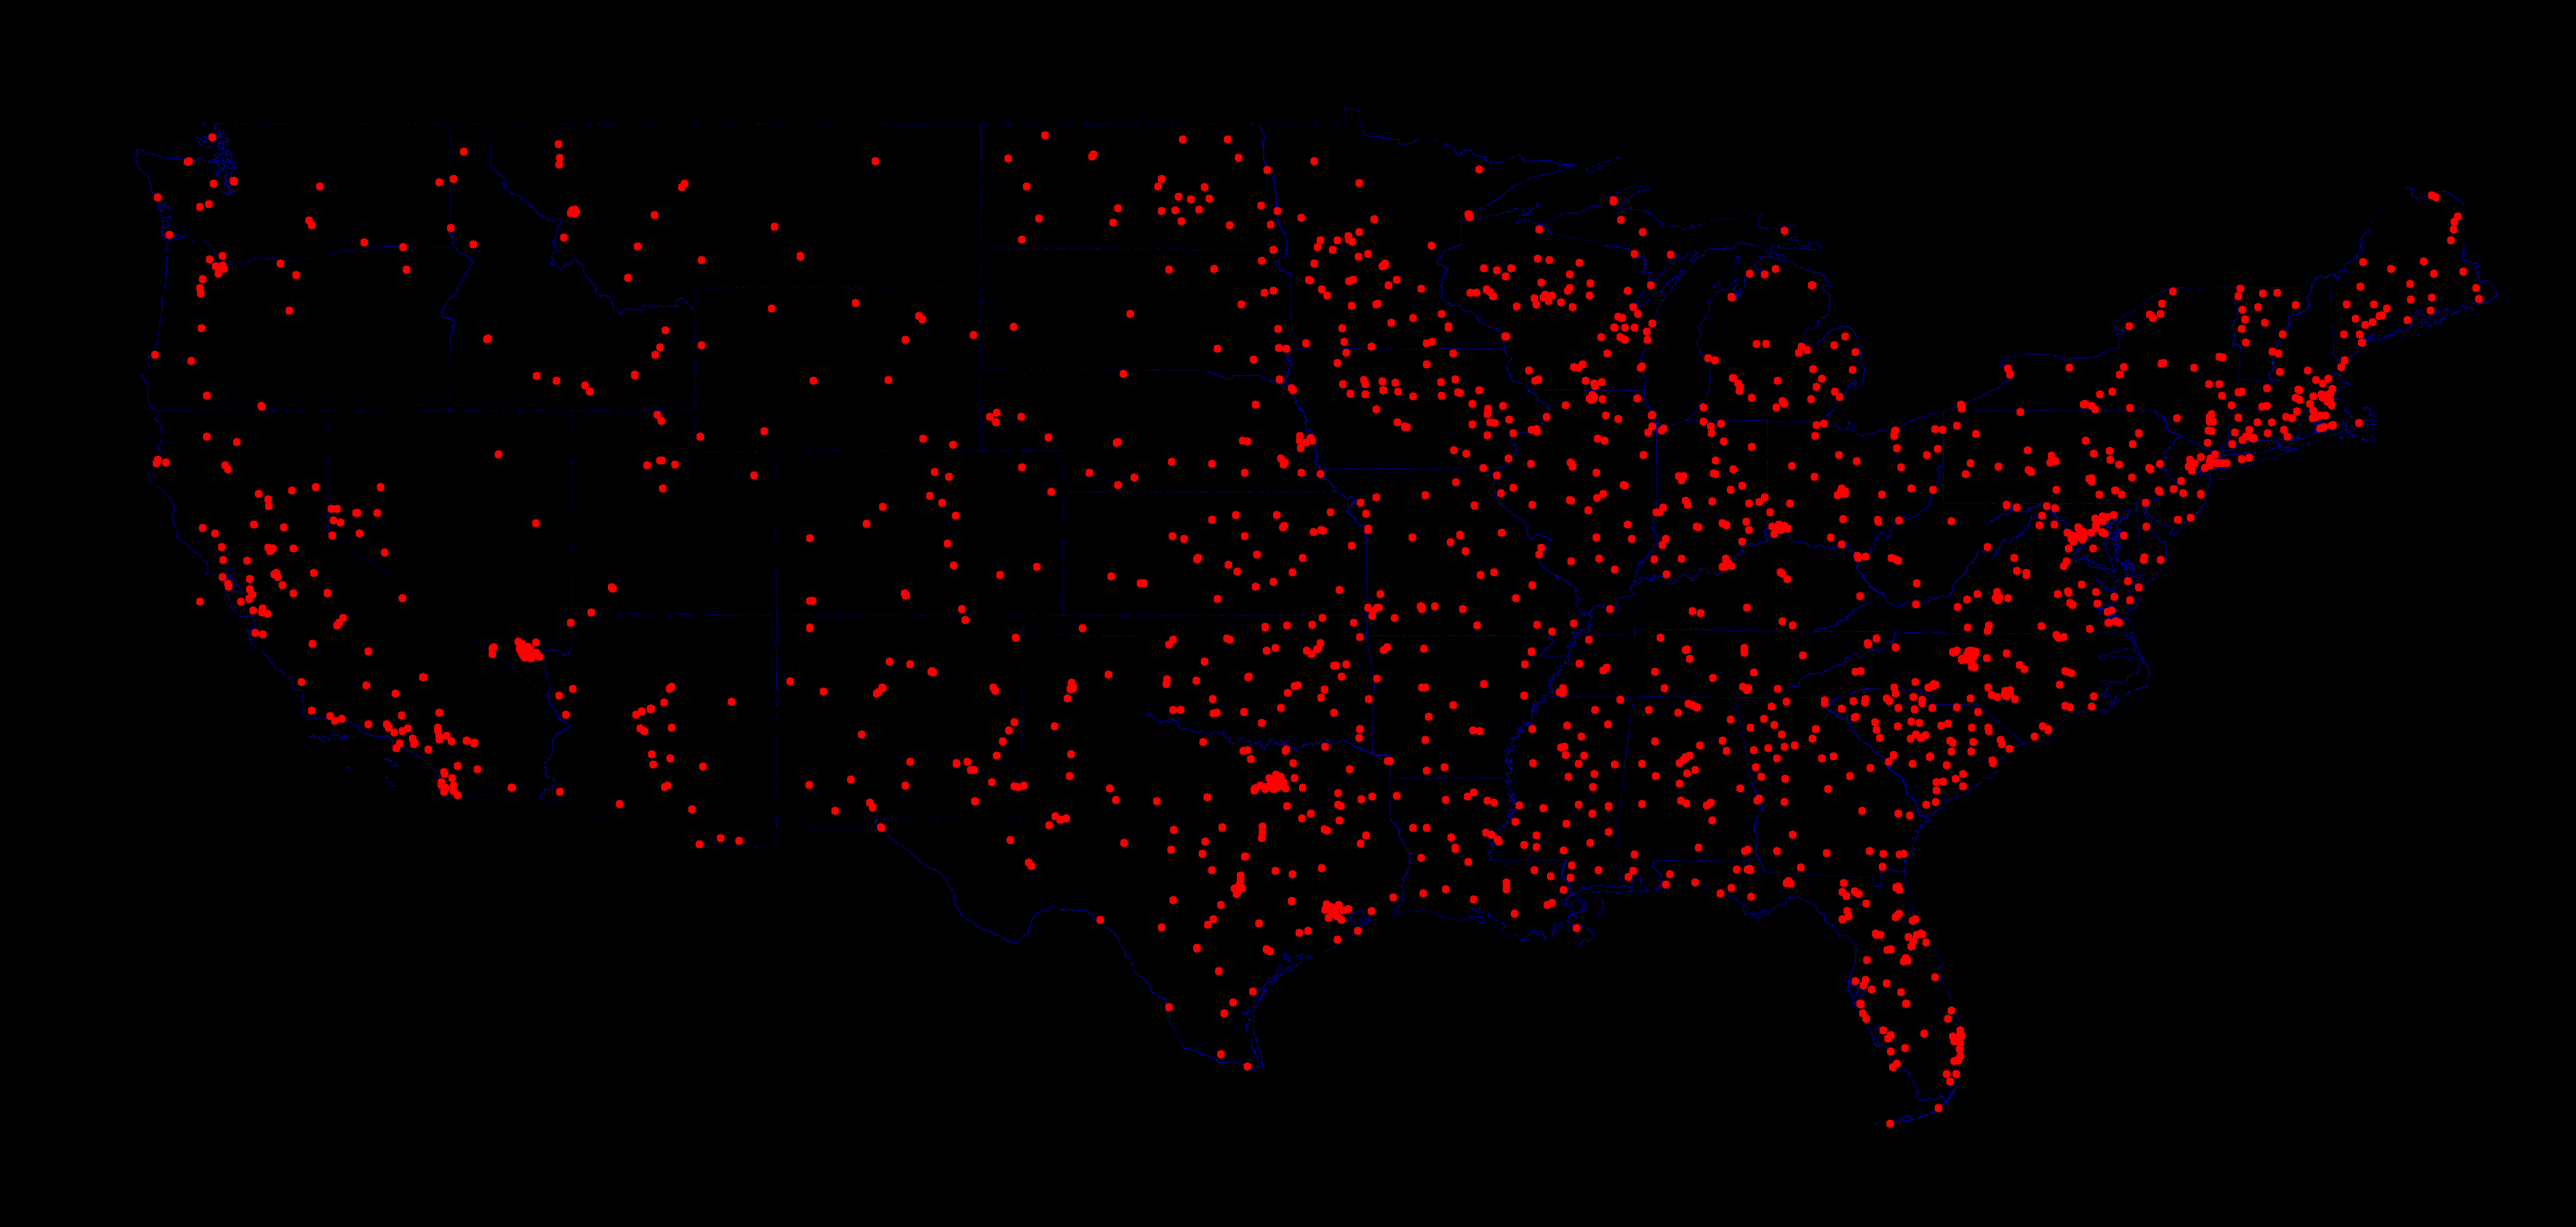
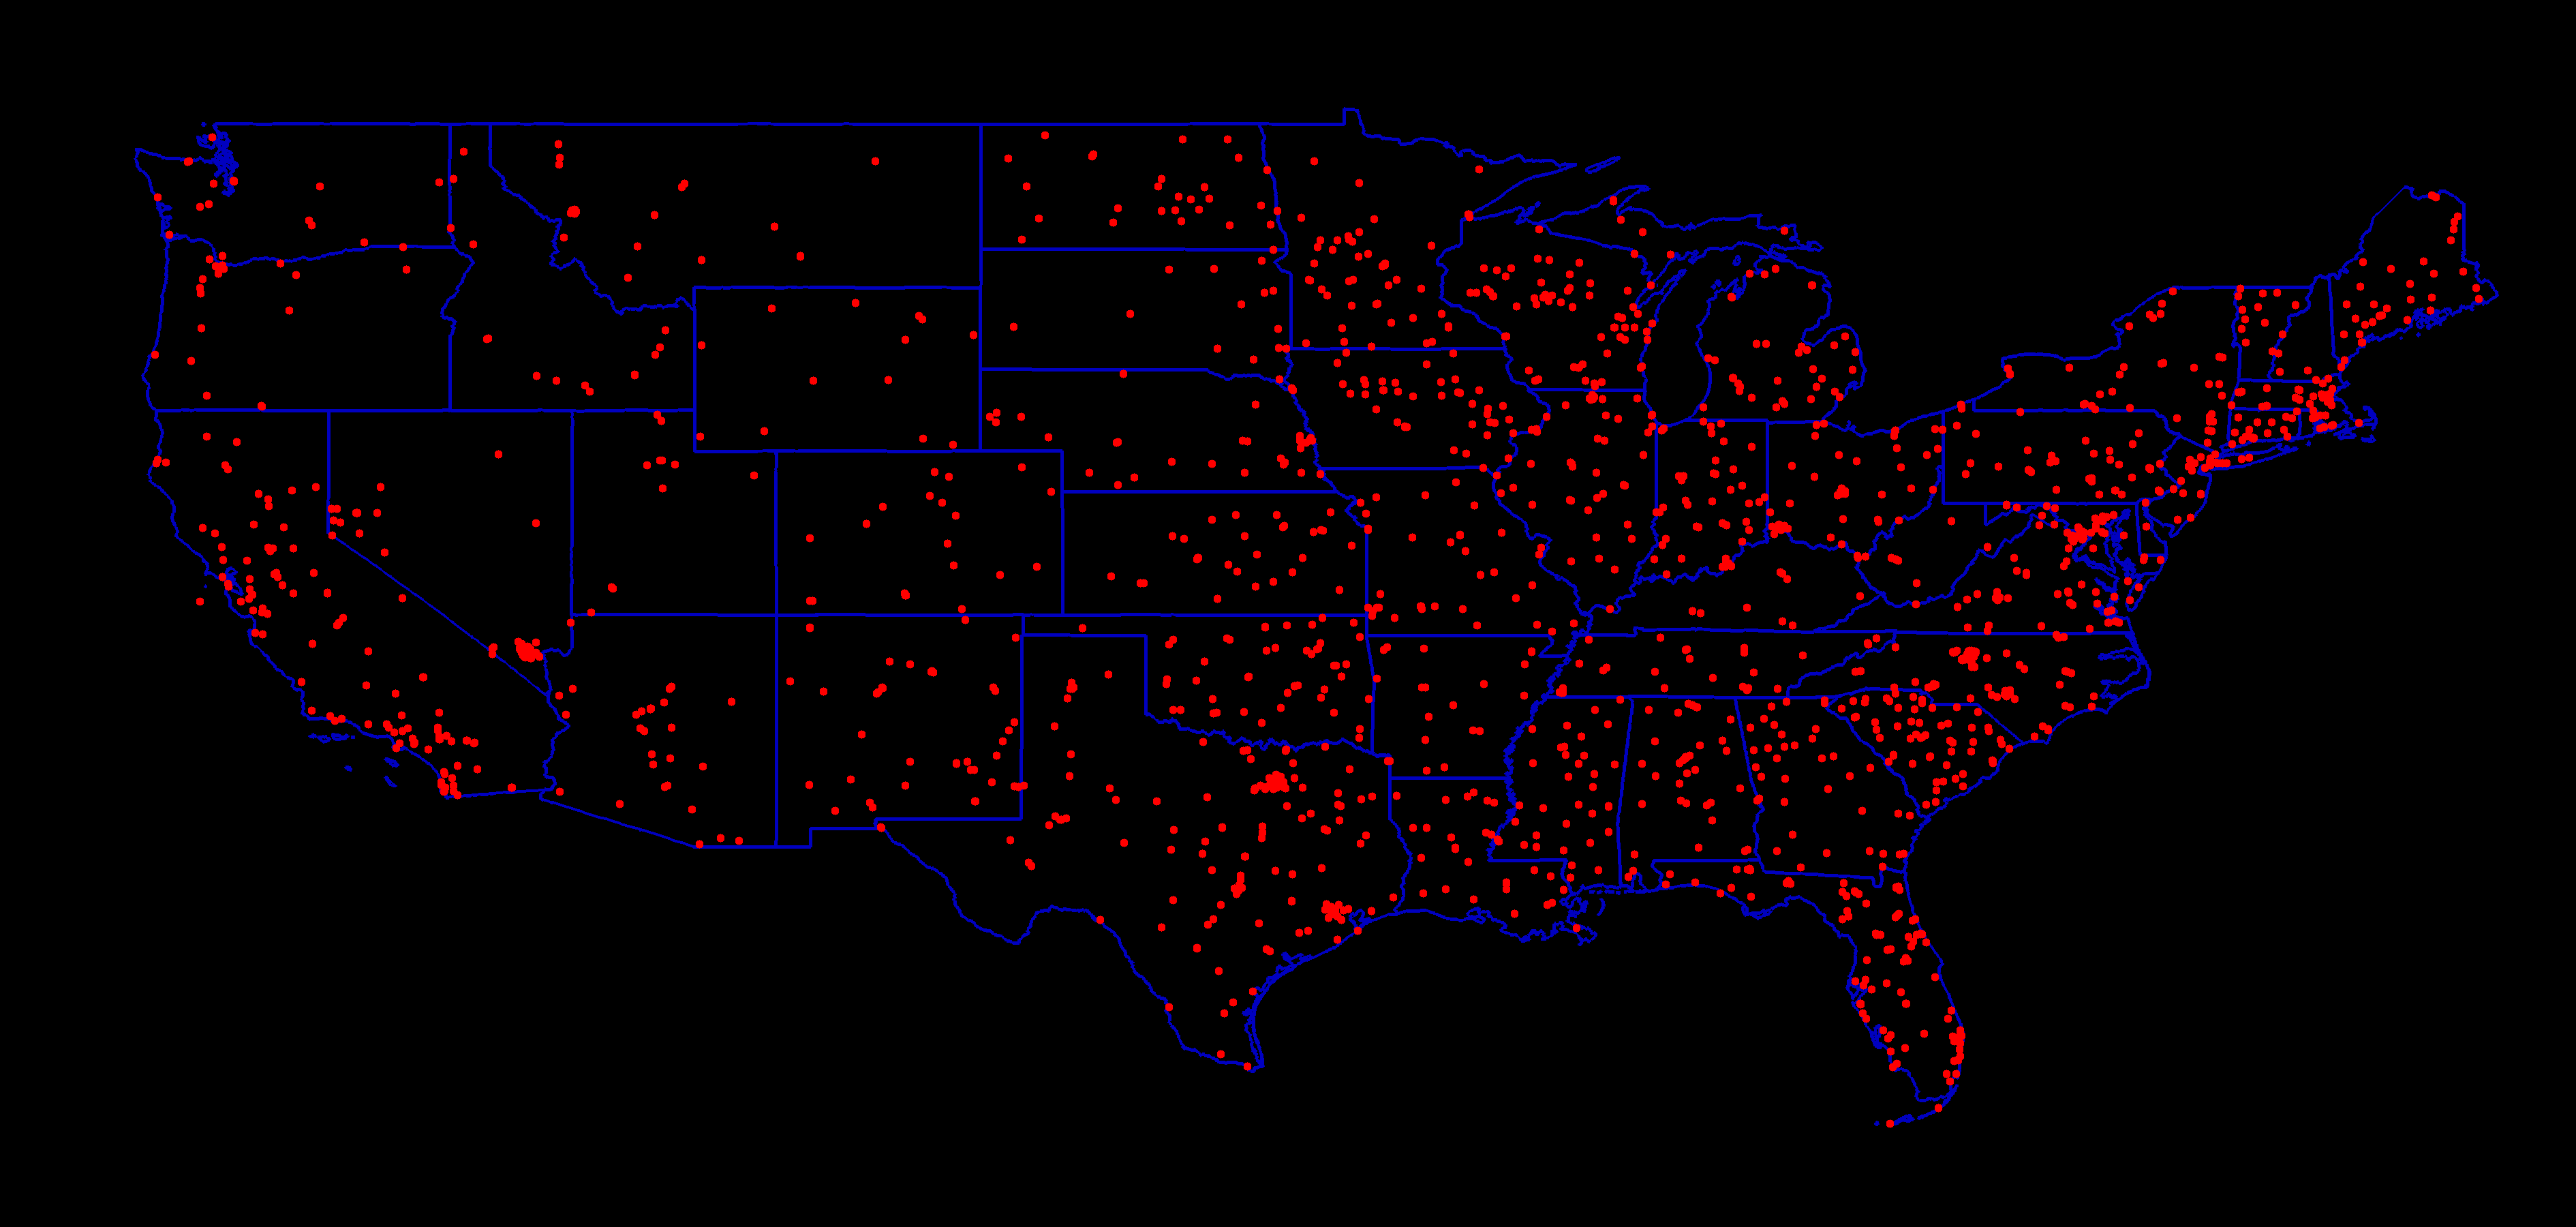
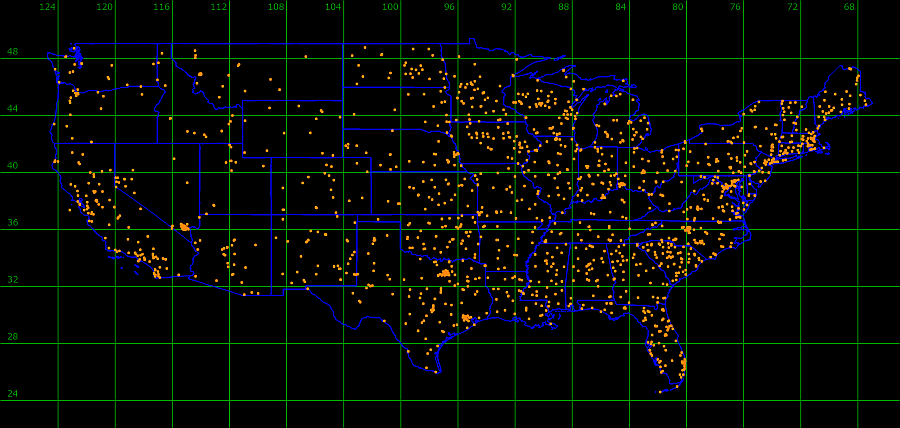
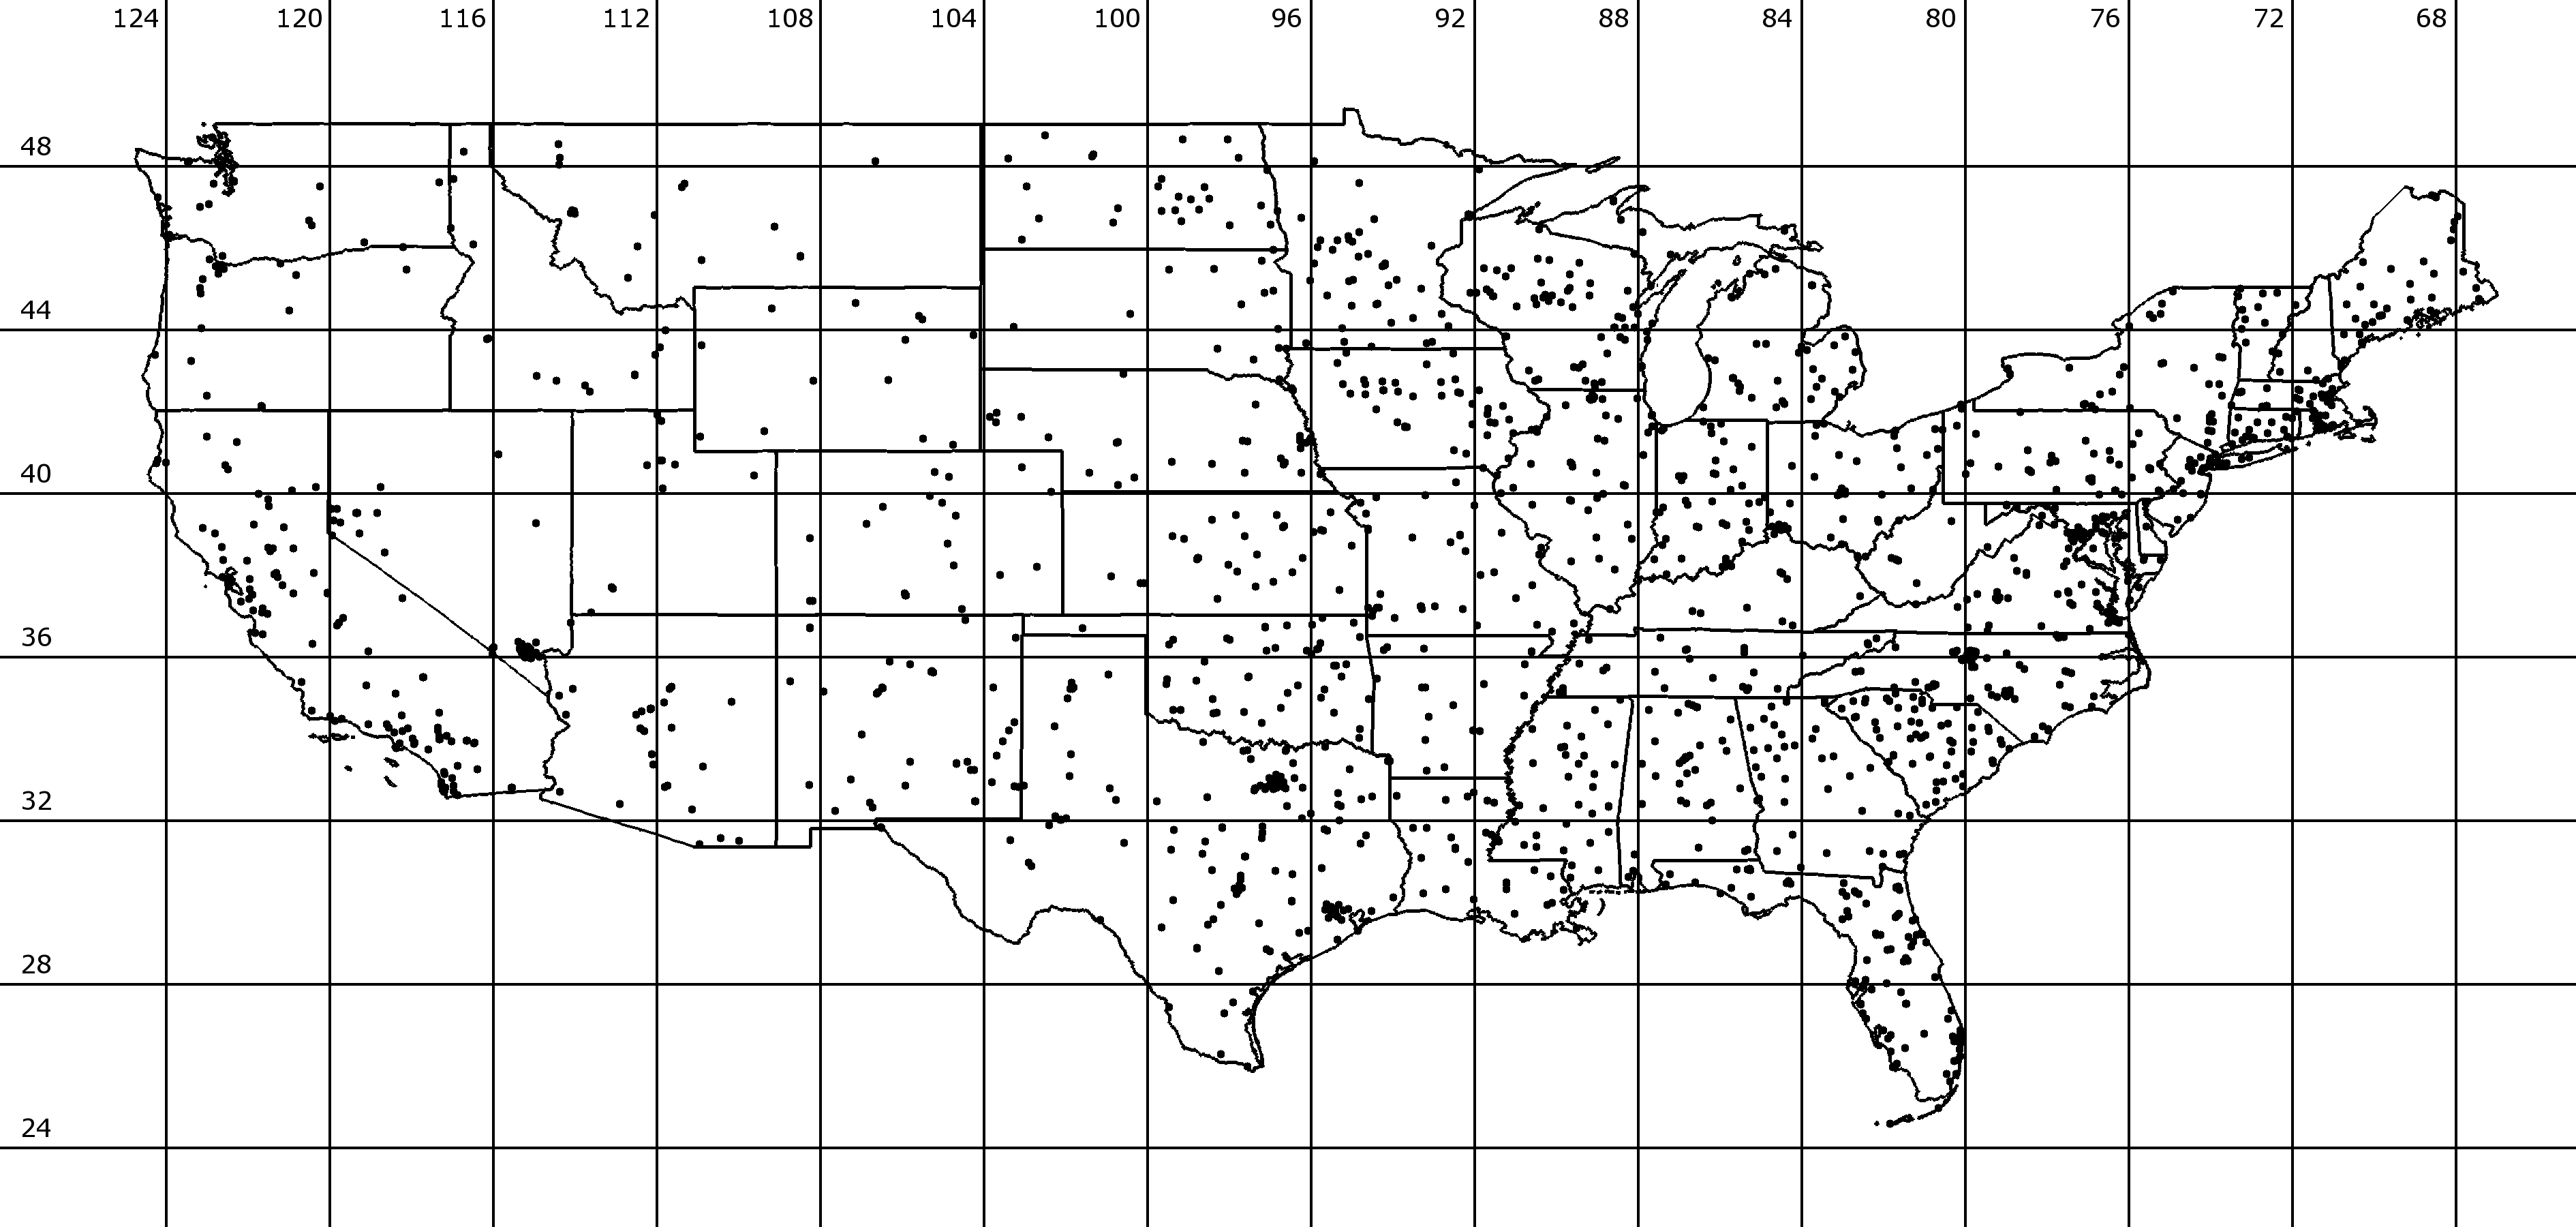
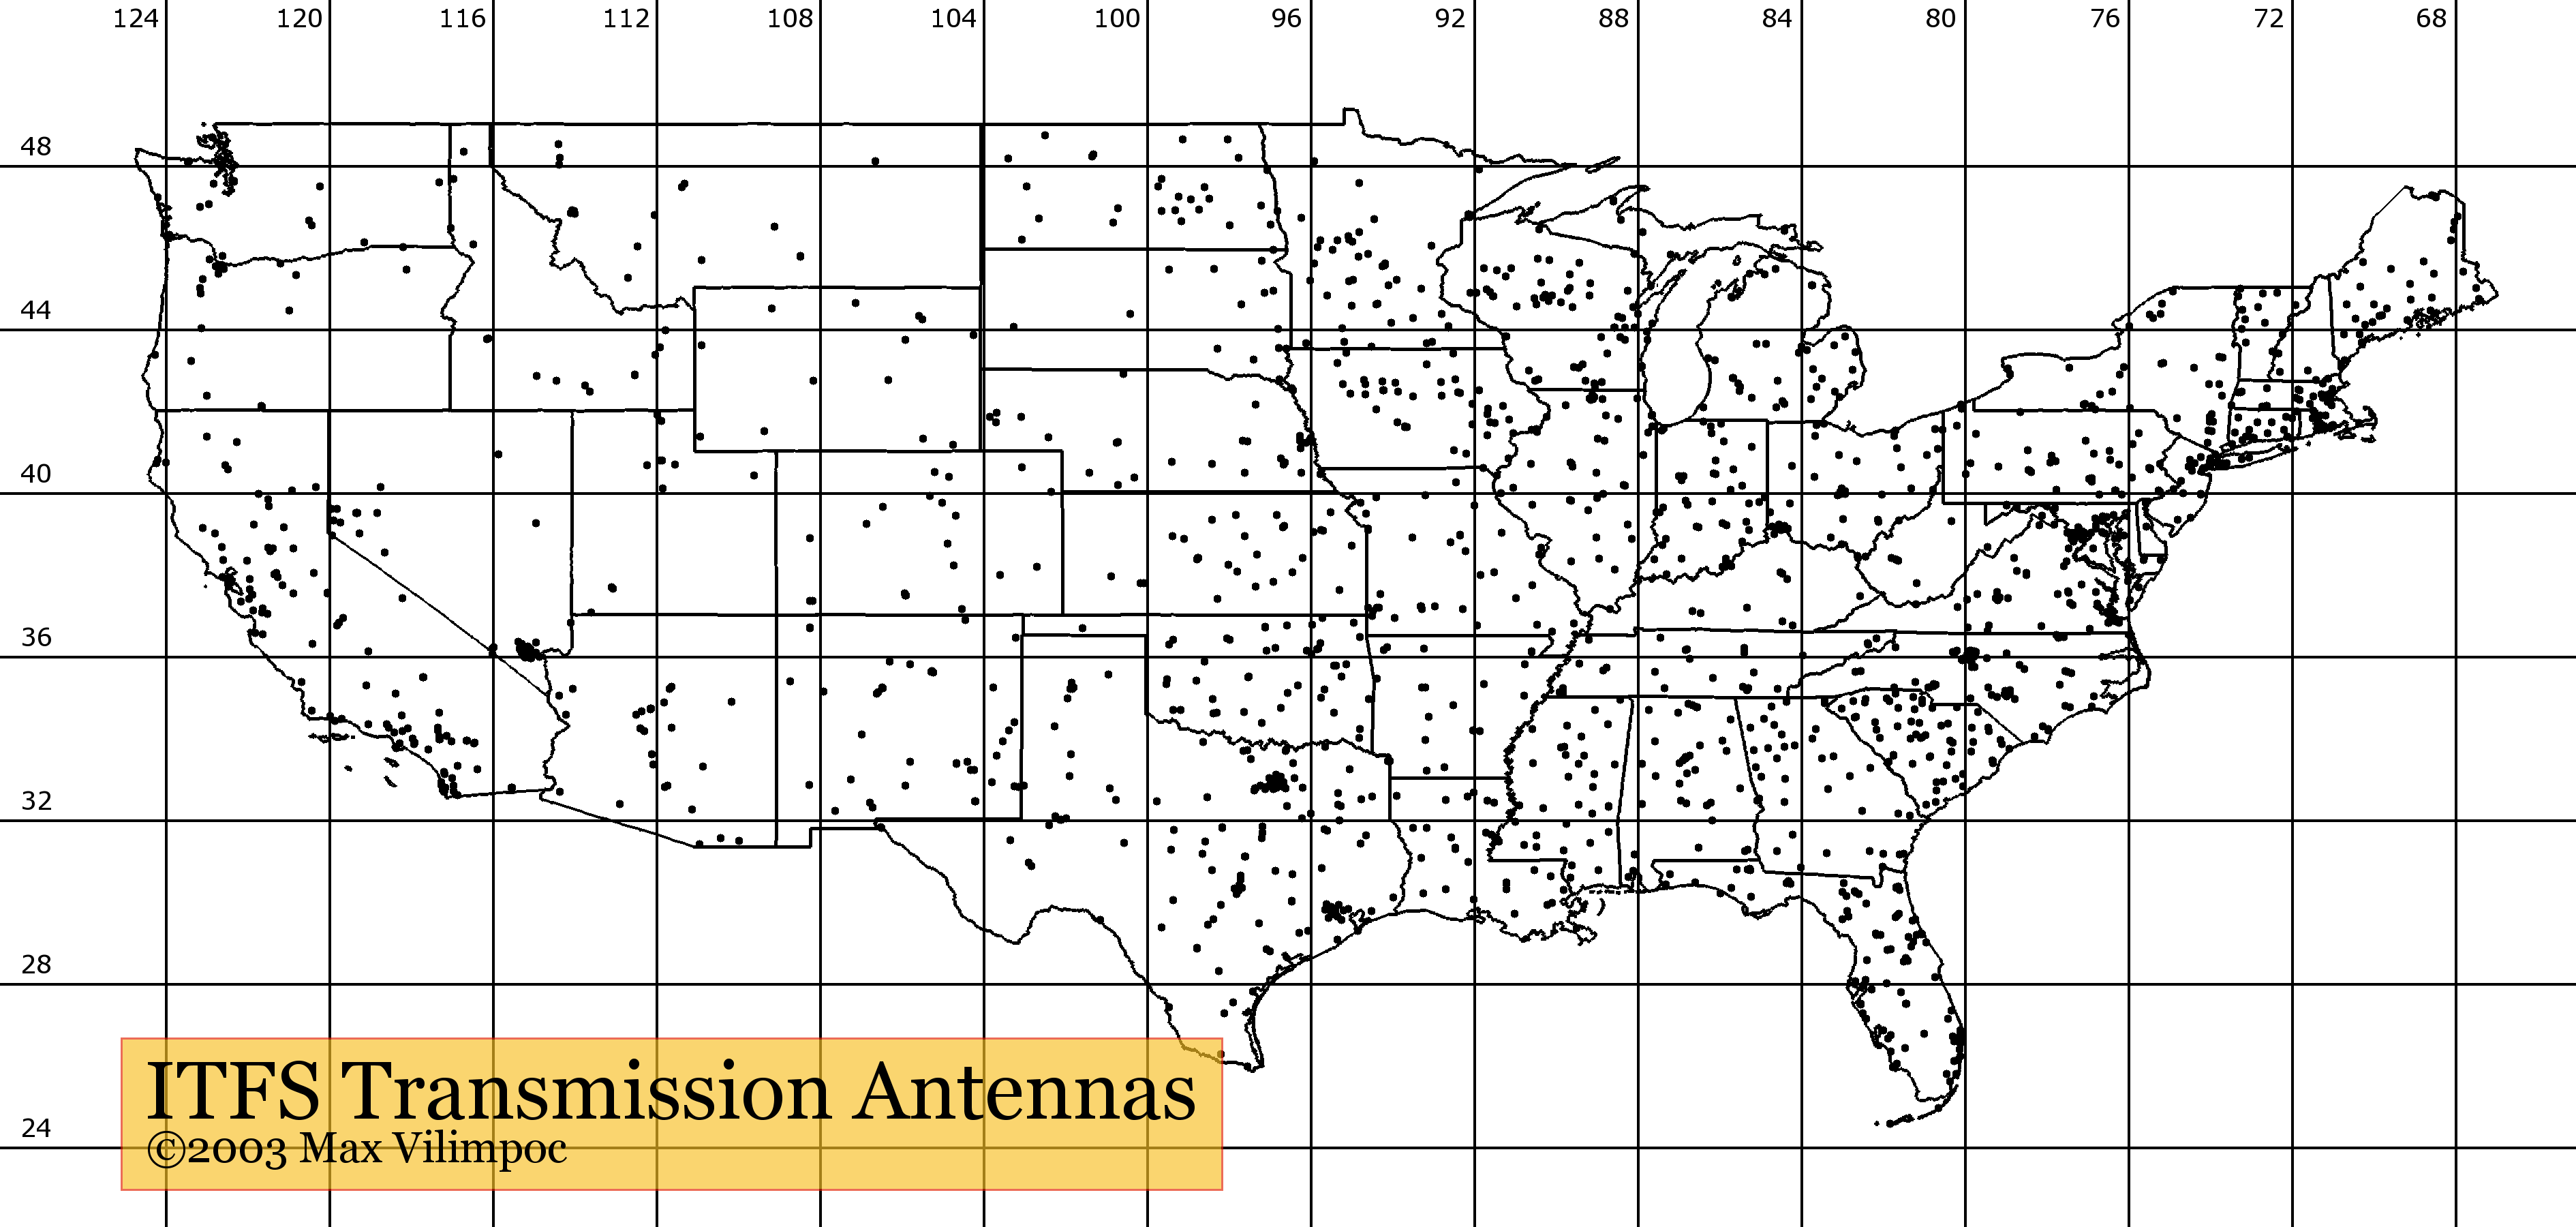
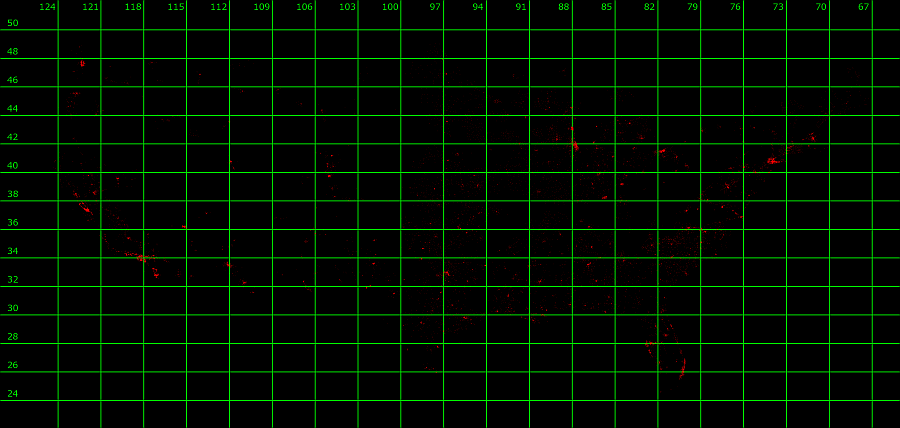
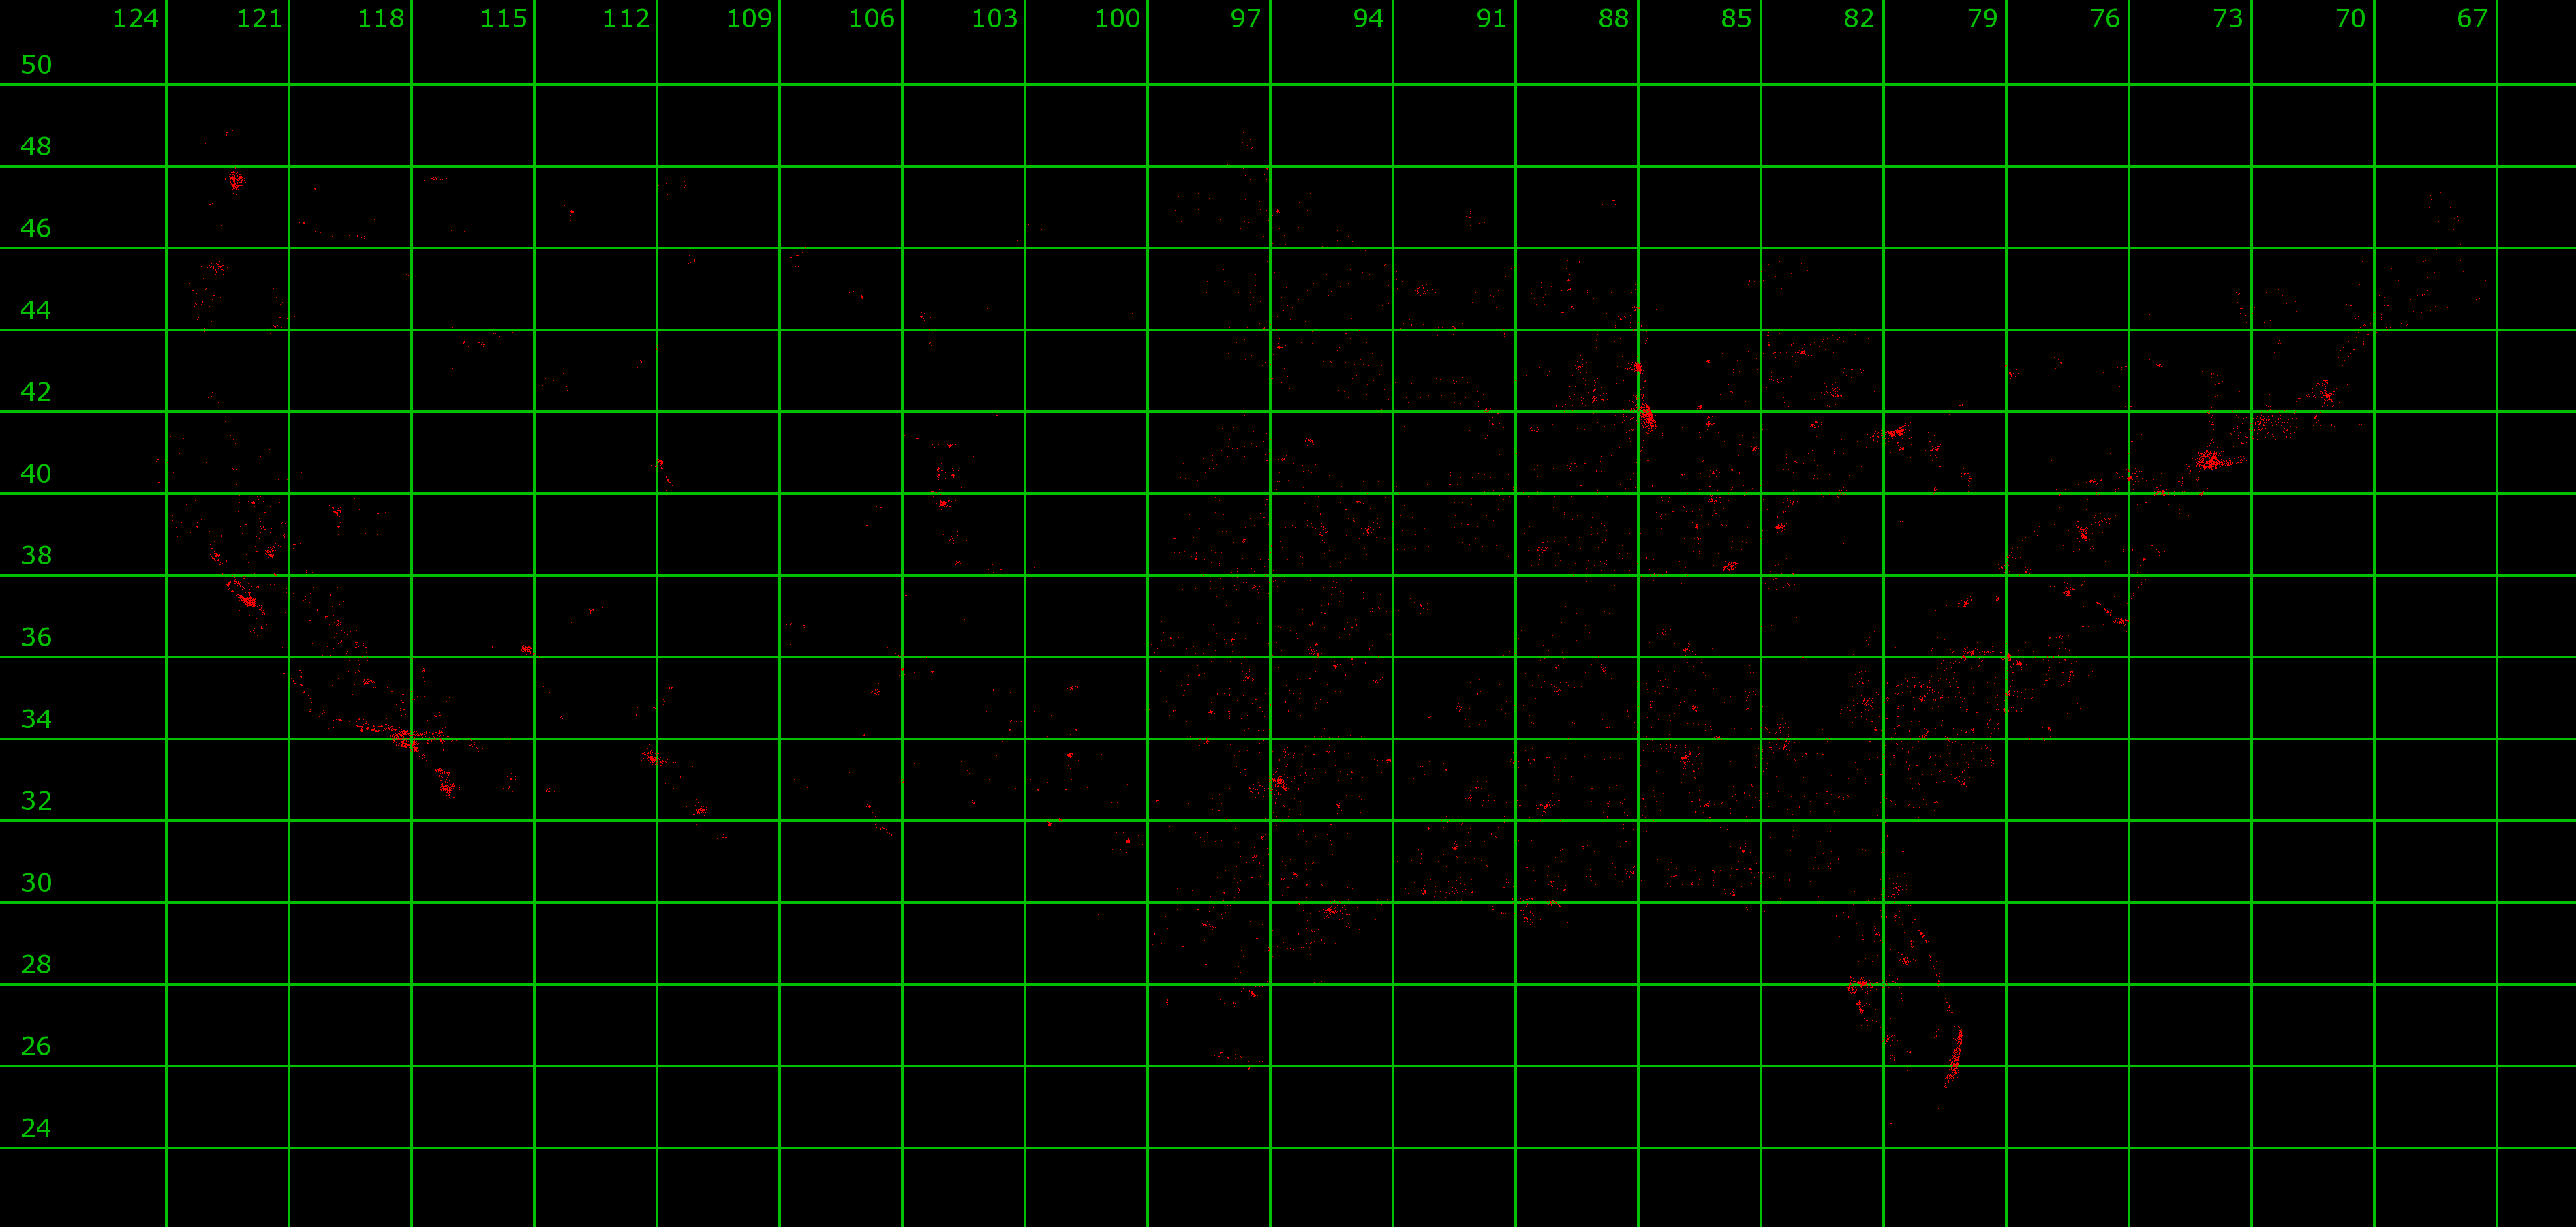
The creation of this map marked the beginning of a process to measure utilization of the Instructional Television Fixed Service frequency band at 2.5 - 2.69 GHz. Selectively polling publicly-available data from the FCC's Universal License System database, each point on the map represents a 12-mile radius of coverage around one or more transmission antennas located at various geographic locations (6,607 as of 07/23/2003).
Although there are many ITFS transmission towers, what is also clear is the fact that a significant portion of the country does not have users in this band. Therefore the question begs an answer: Why is 190 MHz of spectrum tied up in regions where no licensed users exist?
In April of 2003, the U.S. Federal Communications Commission released a Notice of Proposed Rulemaking (WT Docket No. 03-66) in response to a proposal by the Wireless Communication Association, National ITFS Association, and Catholic Television Network regarding the potential for restructuring the ITFS band.
The goal of the restructuring proposal appears to be the potential reallocation of 132 MHz of spectrum to a wireless industry backed by the Wireless Communication Association. The problem with this reallocation is that it comes in the form of a cost-free spectrum giveaway to WCA members, at the expense of shrinking the spectrum allocations of their educational counterparts.
To be fair, the measureable utilization of spectrum by educational users is also subject to question, since the possibility exists that only part of that spectrum is used during the day. For instance, schools are usually not in session after 3 to 4 in the afternoon. Also, depending on individual school schedules, not every class in a school may be using the ITFS service at one time. There may be unused gaps during which the ITFS spectrum remains unused.
 [large] [extra large] |
 [large] [extra large] |
 [large] [extra large] |
 [large] [extra large] |
|
 [large] [extra large] |
 [large] [extra large] |
 [large] [extra large] |
 [large] [extra large] |
|
 [large] [extra large] |
 [large] [extra large] |
 [large] [extra large] |
 [large] [extra large] |
|
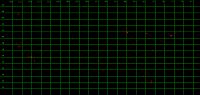
Data points were downloaded from official FCC sources and mirrored into a MySQL database stored locally on my laptop. Using the PHP scripting language, in concert with the GD graphics drawing library, I wrote a program that converted geographic coordinates in Degree Minute Second format into a raster format. Once rasterized, these pixels were plotted on a blank graphic canvas and saved into as either JPEG or PNG files. State-level outlines were derived from ArcView ASCII export files freely available from the U.S. Census Bureau. The maps have an accuracy of 1 minute or roughly 1 mile per pixel.
[last updated 07/25/2003 - 15:29:36, mv]