 +
+  =
= 
| 1 | 2 | 3 | 4-5 | 6-7 | 8-10 | 11-14 | 15-25 | 26-53 |

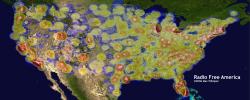
![Spectrum Utilization Map [1280x547]](rfa-intensity-map-1280x0547.jpg)
![Spectrum Utilization Map [2560x1024]](rfa-intensity-map-2560x1024.jpg)
![Spectrum Utilization Map [7860x3360]](rfa-intensity-map-7860x3360.jpg)
![Population Map [2048x875]](popgrid-colorize-small+colorbar.jpg)
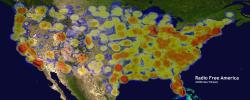
![Composite Spectrum + Population Map [1280x527]](rfa-composite-pop+tv-cropped-1280x0527.jpg)
![Composite Spectrum + Population Map [1600x659]](rfa-composite-pop+tv-cropped-1600x0659.jpg)
![Composite Spectrum + Population Map [2560x1024]](rfa-composite-pop+tv-cropped-2560x1024.jpg)
Channel      Covered        Total   Utilization      Non-
          Population   Population                Utilization
------------------------------------------------------------
    2      135645739    294833827      46.0%        54.0%
    3      110345749        "          37.4%        62.6%
    4      146670279        "          49.7%        50.3%
    5      147071290        "          49.9%        50.1%
    6      101762390        "          34.5%        65.5%
    7      121638961        "          41.3%        58.7%
    8       89743845        "          30.4%        69.6%
    9      128739381        "          43.7%        56.3%
   10      123518548        "          41.9%        58.1%
   11      108257685        "          36.7%        63.3%
   12       95030922        "          32.2%        67.8%
   13      136470745        "          46.3%        53.7%
   14       55114286        "          18.7%        81.3%
   15       44566351        "          15.1%        84.9%
   16       40539673        "          13.8%        86.2%
   17       94855829        "          32.2%        67.8%
   18       68722995        "          23.3%        76.7%
   19       91931877        "          31.2%        68.8%
   20       91599128        "          31.1%        68.9%
   21      101467478        "          34.4%        65.6%
   22      102728116        "          34.8%        65.2%
   23      108628601        "          36.8%        63.2%
   24       84685218        "          28.7%        71.3%
   25       95512042        "          32.4%        67.6%
   26       89363816        "          30.3%        69.7%
   27      100894159        "          34.2%        65.8%
   28       91281652        "          31.0%        69.0%
   29      115694199        "          39.2%        60.8%
   30       88168472        "          29.9%        70.1%
   31      132827743        "          45.1%        54.9%
   32      119082598        "          40.4%        59.6%
   33       71185656        "          24.1%        75.9%
   34      118453601        "          40.2%        59.8%
   35      118438494        "          40.2%        59.8%
   36      102807197        "          34.9%        65.1%
   37      ------- Reserved for Radio Astronomy  --------
   38       98163455        "          33.3%        66.7%
   39      112703469        "          38.2%        61.8%
   40       95470297        "          32.4%        67.6%
   41      125561642        "          42.6%        57.4%
   42       97061686        "          32.9%        67.1%
   43      130154567        "          44.1%        55.9%
   44      104843921        "          35.6%        64.4%
   45       80667672        "          27.4%        72.6%
   46       78893663        "          26.8%        73.2%
   47       73812777        "          25.0%        75.0%
   48      136729680        "          46.4%        53.6%
   49       89802640        "          30.5%        69.5%
   50      115522415        "          39.2%        60.8%
   51       79903413        "          27.1%        72.9%
   52      111816006        "          37.9%        62.1%
   53       78407248        "          26.6%        73.4%
   54       88734724        "          30.1%        69.9%
   55       61465676        "          20.8%        79.2%
   56       92324756        "          31.3%        68.7%
   57       77979680        "          26.4%        73.6%
   58       88400169        "          30.0%        70.0%
   59       71071601        "          24.1%        75.9%
   60       64572082        "          21.9%        78.1%
   61       60274853        "          20.4%        79.6%
   62       81255403        "          27.6%        72.4%
   63       44100281        "          15.0%        85.0%
   64       37022807        "          12.6%        87.4%
   65       57100734        "          19.4%        80.6%
   66       83545056        "          28.3%        71.7%
   67       52129049        "          17.7%        82.3%
   68       55016781        "          18.7%        81.3%
   69       43624435        "          14.8%        85.2%
------------------------------------------------------------
Totals                               2117.1%      4682.9%
In other words, 21 channels of 6 MHz spectrum are completely utilized, if
we look at spectrum on a purely per-Population-covered basis. Whereas 46 channels worth
of 6 MHz spectrum are either, a) not utilized for economic reasons in a market
area or b) not utilized because of guard band industrial policy, and therefore
have no population coverage. While this measure conveniently ignores the fact
that the underutilized spectrum by channel is non-contiguous across the continental United
States, the digital television transition could be used to structurally adjust the
organization of the television spectrum to pack broadcasters into a tighter contiguous
frequency range, thus freeing up large amounts of propagation-valuable spectrum.
There is also the issue that some markets are already mostly packed with channel coverage, which this particular analysis discounts by averaging. But this channel coverage is usually due to the fact that broadcasters were granted an additional, free DTV license, so very likely in the major Metropolitan Statistical Areas, the actual spectrum necessary to transmit program content could be chopped in half by removing the analog simulcast. This was ostensibly the original intent of the DTV transition, rather than turning into an incumbent spectrum giveaway.
Finally, in examining the Per-Channel Coverage Plots below, the question should be asked: Is it still worth nationally guarding the underutilized spectrum used by a few lingering analog television stations on Channels 60 - 69? Or are there more valuable uses of the bandwidth that could be expedited, as originally intended, towards the end of 2006?
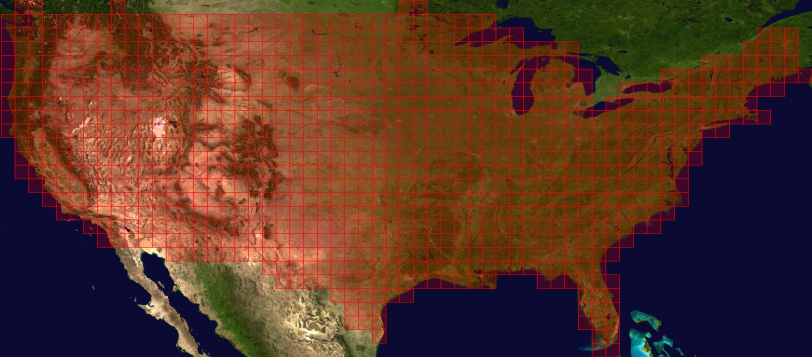
Per-Channel Coverage Plots |
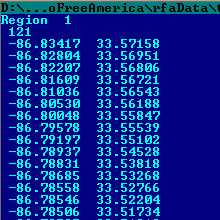
All plots cover a region extending from [52°N x 128°W – 24°N x 64°W] using 120 pixels / degree. [link] |
Source code only. (2006/03/26)
More, different source. (2006/04/02)
Future The programs have a number of current limitations.
- They assume 100% coverage, 100% of the time in the covered area, e.g. f(100,100), which is wrong.
- A number of program parameters are hard coded and should be parameterized.
- Analog and digital coverage are combined in this map. Also, all license classes are included.
- The cache generation program is extremely fat. (That's what I get for using wx-devcpp.)
- The coverage cache data generator and the image generators are separate programs right now.
- They use television coverage data from 10/2005. The latest FCC data (03/2006) seems to cause problems with it. (It appears that this data also has some kind of corruption. Or maybe my program has problems with the data, I haven't checked.)
A number of features would be nice.
- Signal coverage modeling with Longley-Rice or another propagation model using terrain data. (This data is available from the FCC.)
- Statistics generation for coverage in km² by channel, by percentage of population, by city, etc.
- Output by television service type, e.g. filtering by digital/analog, commercial/educational/low-power, translator/repeater, etc.
- Optional state outlines and major city markings might be nice. Though it's actually more fun trying to guess which blobs are which cities.
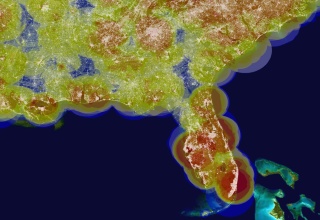
Some of the astute amongst you may notice an odd rectangle in the population coverage extending east of Philadelphia through to the New Jersey coast. This is a problem in the population dataset I don't feel like tracking down (digging through a million lines of binary data in a hex editor is only fun if you're doing something naughty). This leads to the odd situation that some 1.28 million people are packed instead into a 30-arcsecond area, or roughly 1km², if I remember right. Since the algorithm I use to read the data is constant across all input files, I think the error is data driven. I don't know if the FCC knows this, but I am using the same data files they use to process broadcast license paperwork, and I based my read code on their utterly ancient Fortran code (rd_pop_data_full.f). I shudder to think what machine their code compiles on though, as g95 doesn't like it. Just think, U.S. national spectrum policy is run on flat files and old Fortran! Links
The Citizen's Guide to the Airwaves
New America Foundation Spectrum Policy Program
Free Press
Public Knowledge
Consumer's Union
Digital Promise / Digital Opportunity Investment Trust (DOIT)
CATO Institute Tech, Telecom, and Internet Studies
Heritage Foundation