Chrome USB Web Debugging Is Awesome
I've been doing a little bit of tuning for mobile devices on some web work that I'd been doing, and wanted to give the Chrome USB Web Debugging a try. For those living under a rock for the past two years, Google added the ability to live-debug websites on mobile devices using the standard Android Debug Bridge and a copy of mobile Chrome. This means you can debug your websites using a real browser, running on real Android tablets and phones. And, because most mobile browsers are based on some form of Webkit (or Blink), this should lead to reasonable market coverage.
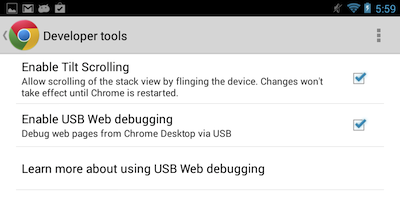
In this case, I tested it using my Nexus 7, by activating the option in mobile Chrome:
After installing the ADB plugin for Google Chrome on the Desktop, the following extension icon shows up in the browser window:
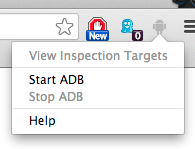
Once you've started ADB via the plugin menu, you can then "View Inspection Targets" and the following list of inspection targets will open up:
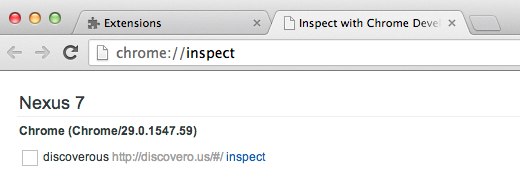
Inspecting the Chrome instance on the Nexus 7 device will open up the familiar Developer Tools window, acting on the mobile device target:
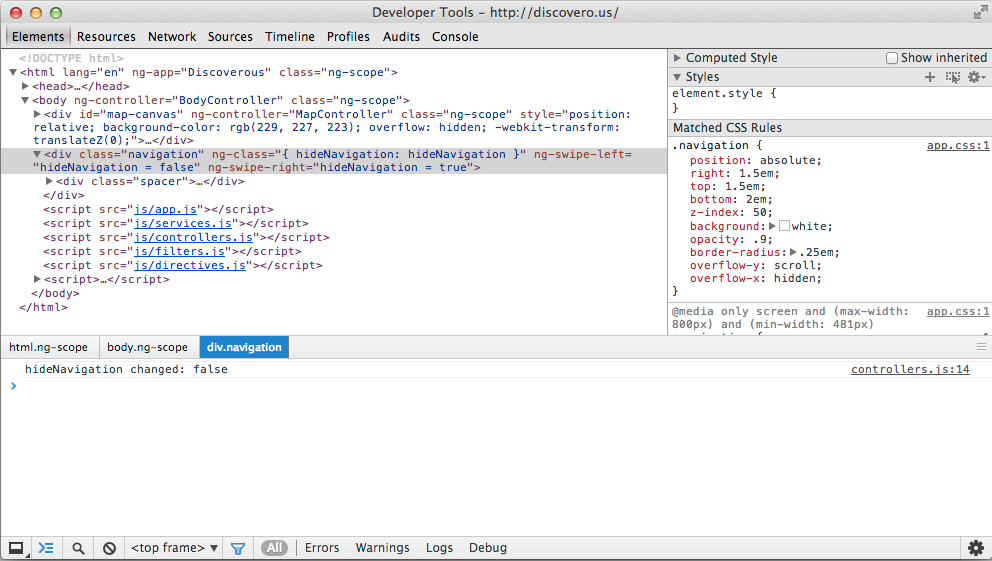
Inspecting a DOM node on the desktop, highlights it on the mobile device, like you're used to:
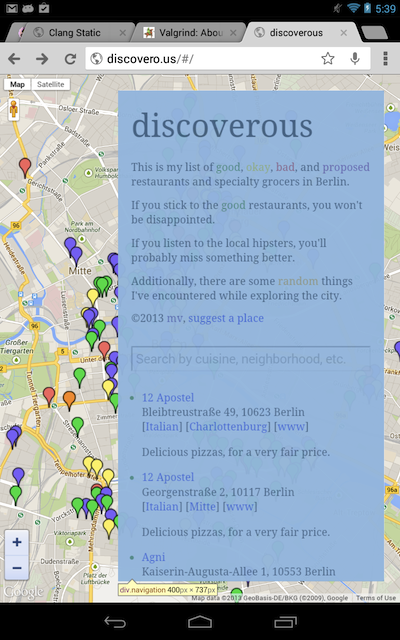
The great thing is that the debugging session is seamless. You are put in full control of an interactive debugger, all of the CSS inspection and modification is there, you can modify anything you want the Javascript console, set breakpoints, inspect, modify, and continue running stopped code. It all just works, which is pretty much the nicest thing you can say about a piece of software (and incidentally the hardest thing to achieve in software engineering).
In short, it's a great way to code, debug, and optimize a website using a real mobile web browser.