hello-gdbserver: A debuggable JNI example for Android
Prolog
Before I get into the rest of the post, here is a link to a .zip of the Eclipse project files if you just want to skip ahead.
The Rest Of The Post
Native software development on Android using its JNI capabilities is incredibly frustrating without proper visibility into the causes of native code errors.
Here is an example project and some background info that shows how to get gdb and gdbserver working to catch those nasty bugs. Just extract the project files into the NDK's sample directory and import the project into Eclipse.
Here were some of the search terms I tried unsuccessfully while trying find something like this:
- using gdb on android
- using ndk-gdb
- debug jni android
- hello world android native code
- hello world android emulator
- debugging using gdbserver android
Requirements
- A phone running Android 2.2 (Froyo) (might work on the emulator, but I didn't focus on that)
- The latest Android NDK (at least r4b)
- Lots of Patience
The NDK-GDB.TXT readme file in the NDK has a good overview of the process of getting a debuggable
Android application + JNI build set up, but I would have much preferred it if Google had simply
included something like a hello-gdbserver test app in the provided samples. One simple app where you
could induce a crash to see what would happen, like a tutorial for smarter bug-hunting. So, I made
this one.
Getting Started
Here's an example of some (exaggeratedly) buggy code in the JNI shared object in
jni/hello-gdbserver.c:
/*
 * Class:     com_example_hellogdbserver_HelloGdbServer
 * Method:    invokeCrash
 * Signature: ()V
 */
JNIEXPORT void JNICALL Java_com_example_hellogdbserver_HelloGdbServer_invokeCrash(JNIEnv *env, jclass clazz)
{
    int *crasher = 0x0;
    *crasher = 0xdeaddead;
}
Fugly. This will kill your app dead without so much as a thank you or goodbye. And you'll never know what hit you, because all you see is a stack trace in DDMS that says "I blew up, and here is a long list of hexadecimal numbers you'll never decode." In any non-trivial app (which is basically any app), you could spend days trying to hunt this down, which is certainly not the best use of engineer time.
I/DEBUG   (   27): *** *** *** *** *** *** *** *** *** *** *** *** *** *** *** ***
I/DEBUG   (   27): Build fingerprint: 'generic/sdk/generic/:1.6/Donut/20842:eng/test-keys'
I/DEBUG   (   27): pid: 260, tid: 260  >>> com.example.hellogdbserver <<<
I/DEBUG   (   27): signal 11 (SIGSEGV), fault addr 00000000
I/DEBUG   (   27):  r0 0000a9d0  r1 4376e278  r2 deaddead  r3 00000000
I/DEBUG   (   27):  r4 bef506b0  r5 00000000  r6 80600ba1  r7 4104baec
I/DEBUG   (   27):  r8 bef50690  r9 4104bae4  10 4104bad4  fp 00000000
I/DEBUG   (   27):  ip 80600ba1  sp bef50680  lr ad00e438  pc 80600bae  cpsr 60000030
I/DEBUG   (   27):          #00  pc 00000bae  /data/data/com.example.hellogdbserver/lib/libhello-gdbserver.so
I/DEBUG   (   27):          #01  pc 0000e434  /system/lib/libdvm.so
I/DEBUG   (   27):          #02  pc 00040b0e  /system/lib/libdvm.so
I/DEBUG   (   27):          #03  pc 000432b6  /system/lib/libdvm.so
I/DEBUG   (   27):          #04  pc 00013198  /system/lib/libdvm.so
I/DEBUG   (   27):          #05  pc 00017be4  /system/lib/libdvm.so
I/DEBUG   (   27):          #06  pc 0001762c  /system/lib/libdvm.so
I/DEBUG   (   27):          #07  pc 000529a8  /system/lib/libdvm.so
I/DEBUG   (   27):          #08  pc 00059eda  /system/lib/libdvm.so
I/DEBUG   (   27):          #09  pc 00013198  /system/lib/libdvm.so
I/DEBUG   (   27):          #10  pc 00017be4  /system/lib/libdvm.so
I/DEBUG   (   27):          #11  pc 0001762c  /system/lib/libdvm.so
I/DEBUG   (   27):          #12  pc 0005282c  /system/lib/libdvm.so
I/DEBUG   (   27):          #13  pc 0003f790  /system/lib/libdvm.so
I/DEBUG   (   27):          #14  pc 00031caa  /system/lib/libdvm.so
I/DEBUG   (   27):          #15  pc 0002a804  /system/lib/libandroid_runtime.so
I/DEBUG   (   27):          #16  pc 0002b306  /system/lib/libandroid_runtime.so
I/DEBUG   (   27):          #17  pc 00008bf2  /system/bin/app_process
I/DEBUG   (   27):          #18  pc 0000bd60  /system/lib/libc.so
I/DEBUG   (   27):          #19  pc b000163c  /system/bin/linker
I/DEBUG   (   27): stack:
I/DEBUG   (   27):     bef50640  00000071
I/DEBUG   (   27):     bef50644  afe0b03f  /system/lib/libc.so
I/DEBUG   (   27):     bef50648  80600ba1  /data/data/com.example.hellogdbserver/lib/libhello-gdbserver.so
I/DEBUG   (   27):     bef5064c  00000007
I/DEBUG   (   27):     bef50650  afe3c9a0
I/DEBUG   (   27):     bef50654  afe39dd4  /system/lib/libc.so
I/DEBUG   (   27):     bef50658  0000a000  [heap]
I/DEBUG   (   27):     bef5065c  00000028
I/DEBUG   (   27):     bef50660  4104896a  /data/dalvik-cache/data@app@com.example.hellogdbserver.apk@classes.dex
I/DEBUG   (   27):     bef50664  00000000
I/DEBUG   (   27):     bef50668  001c5788  [heap]
I/DEBUG   (   27):     bef5066c  001a7710  [heap]
I/DEBUG   (   27):     bef50670  001c56f0  [heap]
I/DEBUG   (   27):     bef50674  ad043199  /system/lib/libdvm.so
I/DEBUG   (   27):     bef50678  df002777
I/DEBUG   (   27):     bef5067c  e3a070ad
I/DEBUG   (   27): #00 bef50680  4376e278  /dev/ashmem/mspace/dalvik-heap/2 (deleted)
I/DEBUG   (   27):     bef50684  0000a9d0  [heap]
I/DEBUG   (   27):     bef50688  00000000
I/DEBUG   (   27):     bef5068c  00000000
I/DEBUG   (   27): #01 bef50690  41295860  /dev/ashmem/dalvik-LinearAlloc (deleted)
I/DEBUG   (   27):     bef50694  0000bc60  [heap]
I/DEBUG   (   27):     bef50698  80600ba1  /data/data/com.example.hellogdbserver/lib/libhello-gdbserver.so
I/DEBUG   (   27):     bef5069c  4376e278  /dev/ashmem/mspace/dalvik-heap/2 (deleted)
I/DEBUG   (   27):     bef506a0  00000071
I/DEBUG   (   27):     bef506a4  0000bc60  [heap]
I/DEBUG   (   27):     bef506a8  bef506b0  [stack]
I/DEBUG   (   27):     bef506ac  ad040b11  /system/lib/libdvm.so
D/Zygote  (   29): Process 260 terminated by signal (11)
I/WindowManager(   67): WIN DEATH: Window{437ee360 com.example.hellogdbserver/com.example.hellogdbserver.HelloGdbServer paused=false}
I/ActivityManager(   67): Process com.example.hellogdbserver (pid 260) has died.
The Google guys have a page (broken link) describing how to transcribe that stuff back into meaningful information, but it's long-winded, manual, and from a practical standpoint a waste of time.
The Fix
Step 1. Tell the gcc C compiler to add debug symbols to your code
In Android.mk add the following line:
LOCAL_CFLAGS := -gProblem 1. Android Ignores You
Oddly enough, even with the debug flag set, you'll notice that the final step of ndk-build, the
Install step, copies and then strips your binaries of debug information. Not very helpful, that.
Just run the ndk-build script with verbose mode active, V=1, and you'll see something like this:
Install: libhello-gdbserver.so => /libs/armeabi
mkdir -p /libs/armeabi
install -p /libhello-gdbserver.so /libs/armeabi/libhello-gdbserver.so
/arm-eabi-4.4.0/bin/arm-eabi-strip --strip-debug  /libs/armeabi/libhello-gdbserver.so
which is due to a line in the setup.mk Makefile fragment:
build/toolchains/arm-eabi-4.4.0/setup.mk:188:
cmd-strip = $(TOOLCHAIN_PREFIX)strip --strip-debug $1
That last line kills your debugging symbols.
Step 2. Ignore Android
So you have to edit it out, as a quick hack, in the install-binary.mk Makefile fragment:
build/core/install-binary.mk:29:
# $(hide) $(call cmd-strip, $(PRIVATE_DST))
A better fix would be to add a real variable check in the Makefile for debug vs. non debug builds and to act accordingly. In any case, your next builds will have full debug symbols in them. So just do a quick
$ ndk-build -B V=1[update: 2010/09/24]
A better fix:
build/core/install-binary.mk:29:
ifneq ($(APP_OPTIM),debug)
    $(hide) $(call cmd-strip, $(PRIVATE_DST))
endif
Now when you're building, you can just specify the APP_OPTIM level as a parameter to ndk-build:
~/android-ndk-r4b/ndk-build -B V=1 APP_OPTIM=debug
~/android-ndk-r4b/ndk-build -B V=1 APP_OPTIM=release
This is also useful because APP_OPTIM can be specified in the Application.mk file.
Step 3. Rebuild Your APK
Ok, so once you have the shared object built, it's time to package it into an APK using Eclipse.
This is pretty standard. Since the ndk-build has "installed" the libhello-gdbserver.so shared object
to the right directory, just do a Build -> Clean, Build -> Rebuild All in Eclipse and wait the
half a second it takes to regenerate the APK.
Try running the application, you should see this:
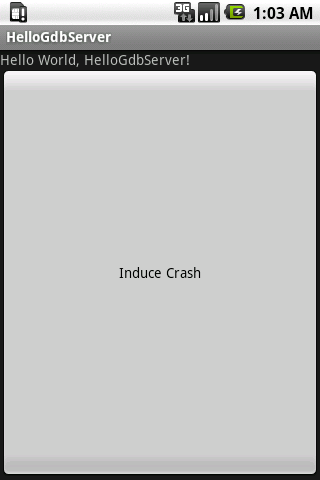
Then, still in the project's directory, call ndk-gdb.
$ pwd
/home/vilimpoc/android-ndk-r4b/samples/hello-gdbserver
$ ~/android-ndk-r4b/ndk-gdb --verbose
Fun Error Message 1
Android NDK installation path: /home/vilimpoc/android-ndk-r4b
Using default adb command: /cygdrive/c/androidDev/android-sdk-windows/tools/adb
ADB version found: Android Debug Bridge version 1.0.26
Using final ADB command: '/cygdrive/c/androidDev/android-sdk-windows/tools/adb -e'
Using auto-detected project path: .
Found package name: com.example.hellogdbserver
Found debuggable flag: true
ABIs targetted by application: armeabi
Device API Level: 8
Device CPU ABI: armeabi
Compatible device ABI: armeabi
Found device gdbserver: /data/data/com.example.hellogdbserver/lib/gdbserver: No such file or directory
ERROR: Non-debuggable application installed on the target device.
Please re-install the debuggable version !
Make sure in AndroidManifest.xml, you've got Debuggable set to true. Rebuild and reinstall.
Fun Error Message 2
$ run-as: Package 'com.example.hellogdbserver' has corrupt installationRebuild and reinstall.
adb uninstall com.example.hellogdbserver
adb install HelloGdbServer.apk
Fun Error Message 3
Sometimes the above message looks like the following, where the information gets mashed up wrongly
into the verbose output from ndk-gdb. e.g. the string run-as: Package 'com.example.hellogdbserver' has corrupt installation was variable-substituted into the command to forward debug information
over tcp/5039.
##### NEW COMMAND
/cygdrive/c/androidDev/android-sdk-windows/tools/adb -e forward tcp:5039 localfilesystem:run-as: Package 'com.example.hellogdbserver' has corrupt installation/debug-socket
##### NEW COMMAND
/cygdrive/c/androidDev/android-sdk-windows/tools/adb -e shell run-as com.example.hellogdbserver lib/gdbserver +debug-socket --attach 7492

Android Debug Bridge version 1.0.26
-d                            - directs command to the only connected USB device
                                returns an error if more than one USB device is present.
-e                            - directs command to the only running emulator.
                                returns an error if more than one emulator is running.
[... snip ...]
- If it is "system" or "data", only the corresponding partition is updated.
ERROR: Could not setup network redirection to gdbserver?
Maybe using --port=<port> to use a different TCP port might help?
The solution remains the same: Rebuild APK and reinstall.
Fun Error Message 4
run-as: Package 'com.example.hellogdbserver' is unknownSometimes you must Clean and Rebuild your entire project in Eclipse, especially if you make a dumb
mistake, like change your Java Package from "com.examples.hellogdbserver" to
"com.example.hellogdbserver". Sometimes that slight change doesn't quite make it into the package,
or the aapt package manager doesn't see it, and you end up with an application running under a
package name that isn't what you expect, and isn't one that run-as can find. Try adb install /
uninstalling a couple of times, or uninstalling via the phone's Settings -> Applications menu to
get the app into a state where the phone recognizes the package.
The rule of thumb is: If adb install/uninstall can see your program by its package name, then so can gdb.
When It Works, It Looks Like This
vilimpoc@funky ~
$ ls
android-ndk-r4b  cygdrive

vilimpoc@funky ~
$ cd android-ndk-r4b/

vilimpoc@funky ~/android-ndk-r4b
$ ls
GNUmakefile  README.TXT  apps  build  docs  ndk-build  ndk-gdb  out  samples  sources

vilimpoc@funky ~/android-ndk-r4b
$ cd samples

vilimpoc@funky ~/android-ndk-r4b/samples
$ ls
bitmap-plasma  hello-exe  hello-gdbserver  hello-gl2  hello-jni  hello-neon  san-angeles  two-libs

vilimpoc@funky ~/android-ndk-r4b/samples
$ cd hello-gdbserver

vilimpoc@funky ~/android-ndk-r4b/samples/hello-gdbserver
$ ls -l
total 5
-rwx------+ 1 vilimpoc Domain Users 721 2010-09-23 16:15 AndroidManifest.xml
drwx------+ 1 vilimpoc Domain Users   0 2010-09-23 15:12 assets
drwx------+ 1 vilimpoc Domain Users   0 2010-09-23 17:24 bin
-rwx------+ 1 vilimpoc Domain Users 364 2010-09-23 15:12 default.properties
drwx------+ 1 vilimpoc Domain Users   0 2010-09-23 15:12 gen
drwx------+ 1 vilimpoc Domain Users   0 2010-09-23 16:20 jni
drwxr-xr-x+ 1 vilimpoc Domain Users   0 2010-09-23 15:23 libs
drwxr-xr-x+ 1 vilimpoc Domain Users   0 2010-09-23 15:23 obj
drwx------+ 1 vilimpoc Domain Users   0 2010-09-23 15:13 res
drwx------+ 1 vilimpoc Domain Users   0 2010-09-23 14:49 src

vilimpoc@funky ~/android-ndk-r4b/samples/hello-gdbserver
$ ~/android-ndk-r4b/ndk-gdb --verbose
Android NDK installation path: /home/vilimpoc/android-ndk-r4b
Using default adb command: /cygdrive/c/androidDev/android-sdk-windows/tools/adb
ADB version found: Android Debug Bridge version 1.0.26
Using final ADB command: '/cygdrive/c/androidDev/android-sdk-windows/tools/adb'
Using auto-detected project path: .
Found package name: com.example.hellogdbserver
Found debuggable flag: true
ABIs targetted by application: armeabi
Device API Level: 8
Device CPU ABIs: armeabi-v7a armeabi
Compatible device ABI: armeabi
Found device gdbserver: /data/data/com.example.hellogdbserver/lib/gdbserver
Using gdb setup init: /home/vilimpoc/android-ndk-r4b/samples/hello-gdbserver/libs/armeabi/gdb.setup
Using toolchain prefix: /home/vilimpoc/android-ndk-r4b/build/prebuilt/windows/arm-eabi-4.4.0/bin/arm-eabi-
Using app out directory: /home/vilimpoc/android-ndk-r4b/samples/hello-gdbserver/obj/local/armeabi
Found data directory: '/data/data/com.example.hellogdbserver'
Found first launchable activity: .HelloGdbServer
Launching activity: com.example.hellogdbserver/.HelloGdbServer
##### NEW COMMAND
/cygdrive/c/androidDev/android-sdk-windows/tools/adb shell am start -n com.example.hellogdbserver/.HelloGdbServer
Starting: Intent { cmp=com.example.hellogdbserver/.HelloGdbServer }
##### NEW COMMAND
/cygdrive/c/androidDev/android-sdk-windows/tools/adb shell sleep 1
Found running PID: 1948
Launching gdbserver.
Launched gdbserver successfully.
Setup network redirection
##### NEW COMMAND
##### NEW COMMAND
/cygdrive/c/androidDev/android-sdk-windows/tools/adb shell run-as com.example.hellogdbserver lib/gdbserver +debug-socket --a
/cygdrive/c/androidDev/android-sdk-windows/tools/adb forward tcp:5039 localfilesystem:/data/data/com.example.hellogdbserver/
debug-socket
Attached; pid = 1948
Listening on sockaddr socket debug-socket
##### NEW COMMAND
/cygdrive/c/androidDev/android-sdk-windows/tools/adb pull /system/bin/app_process C:/cygwin/home/vilimpoc/android-ndk-r4b/sa
mples/hello-gdbserver/obj/local/armeabi/app_process
5 KB/s (0 bytes in 5680.001s)
Pulled  from device/emulator.
GNU gdb 6.6
Copyright (C) 2006 Free Software Foundation, Inc.
GDB is free software, covered by the GNU General Public License, and you are
welcome to change it and/or distribute copies of it under certain conditions.
Type "show copying" to see the conditions.
There is absolutely no warranty for GDB.  Type "show warranty" for details.
This GDB was configured as "--host=i686-pc-cygwin --target=arm-elf-linux".
Error while mapping shared library sections:
/system/bin/linker: No such file or directory.
Error while mapping shared library sections:
libc.so: No such file or directory.
Error while mapping shared library sections:
libstdc++.so: No such file or directory.
Error while mapping shared library sections:
libm.so: No such file or directory.
Error while mapping shared library sections:
liblog.so: No such file or directory.
Error while mapping shared library sections:
libcutils.so: No such file or directory.
Error while mapping shared library sections:
libz.so: No such file or directory.
Error while mapping shared library sections:
libutils.so: No such file or directory.
Error while mapping shared library sections:
libbinder.so: No such file or directory.
Error while mapping shared library sections:
libexpat.so: No such file or directory.
Error while mapping shared library sections:
libcrypto.so: No such file or directory.
Error while mapping shared library sections:
libssl.so: No such file or directory.
Error while mapping shared library sections:
libicudata.so: No such file or directory.
Error while mapping shared library sections:
libicuuc.so: No such file or directory.
Error while mapping shared library sections:
libicui18n.so: No such file or directory.
Error while mapping shared library sections:
libsqlite.so: No such file or directory.
Error while mapping shared library sections:
libnativehelper.so: No such file or directory.
Error while mapping shared library sections:
libnetutils.so: No such file or directory.
Error while mapping shared library sections:
libEGL.so: No such file or directory.
Error while mapping shared library sections:
libwpa_client.so: No such file or directory.
Error while mapping shared library sections:
librpc.so: No such file or directory.
Error while mapping shared library sections:
libgps.so: No such file or directory.
Error while mapping shared library sections:
libhardware_legacy.so: No such file or directory.
Error while mapping shared library sections:
libpixelflinger.so: No such file or directory.
Error while mapping shared library sections:
libhardware.so: No such file or directory.
Error while mapping shared library sections:
libui.so: No such file or directory.
Error while mapping shared library sections:
libsurfaceflinger_client.so: No such file or directory.
Error while mapping shared library sections:
libcamera_client.so: No such file or directory.
Error while mapping shared library sections:
libemoji.so: No such file or directory.
Error while mapping shared library sections:
libjpeg.so: No such file or directory.
Error while mapping shared library sections:
libskia.so: No such file or directory.
Error while mapping shared library sections:
libGLESv1_CM.so: No such file or directory.
Error while mapping shared library sections:
libskiagl.so: No such file or directory.
Error while mapping shared library sections:
libdvm.so: No such file or directory.
Error while mapping shared library sections:
libGLESv2.so: No such file or directory.
Error while mapping shared library sections:
libETC1.so: No such file or directory.
Error while mapping shared library sections:
libsonivox.so: No such file or directory.
Error while mapping shared library sections:
libmedia.so: No such file or directory.
Error while mapping shared library sections:
libbluedroid.so: No such file or directory.
Error while mapping shared library sections:
libdbus.so: No such file or directory.
Error while mapping shared library sections:
libandroid_runtime.so: No such file or directory.
Error while mapping shared library sections:
libexif.so: No such file or directory.
Error while mapping shared library sections:
libdrm1.so: No such file or directory.
Error while mapping shared library sections:
libvorbisidec.so: No such file or directory.
Error while mapping shared library sections:
libopencore_common.so: No such file or directory.
Error while mapping shared library sections:
libopencore_net_support.so: No such file or directory.
Error while mapping shared library sections:
libopencore_player.so: No such file or directory.
Error while mapping shared library sections:
libomx_sharedlibrary.so: No such file or directory.
Error while mapping shared library sections:
libomx_amrenc_sharedlibrary.so: No such file or directory.
Error while mapping shared library sections:
libstagefright_amrnb_common.so: No such file or directory.
Error while mapping shared library sections:
libstagefright_avc_common.so: No such file or directory.
Error while mapping shared library sections:
libstagefright_color_conversion.so: No such file or directory.
Error while mapping shared library sections:
libstagefright.so: No such file or directory.
Error while mapping shared library sections:
libmedia_jni.so: No such file or directory.
Error while mapping shared library sections:
libstlport.so: No such file or directory.
Error while mapping shared library sections:
libwebcore.so: No such file or directory.
Error while mapping shared library sections:
gralloc.qsd8k.so: No such file or directory.
warning: Unable to find dynamic linker breakpoint function.
GDB will be unable to debug shared library initializers
and track explicitly loaded dynamic code.
warning: shared library handler failed to enable breakpoint
0xafd0ebd8 in ?? ()
(gdb) continue
Continuing.
Tap the "Induce Crash" button. gdb should immediately produce the following:
Program received signal SIGSEGV, Segmentation fault.
0x80300bae in Java_com_example_hellogdbserver_HelloGdbServer_invokeCrash (env=0xaa50, clazz=0x4625f0b8)
 at /home/vilimpoc/android-ndk-r4b/samples/hello-gdbserver/jni/hello-gdbserver.c:29
29              *crasher = 0xdeaddead;

(gdb)
Rejoice In No Longer Needing __android_log_print()
Hallelujah! Usable segmentation fault information. Finally, one can get rid of all those debug print statements!
Questions / Feedback / Code Fail?
File them in the comments and I'll update the above. Thanks!
- Next →
Best Bibimbap in Berlin